
Figures & data
Figure 1. Annual publication outputs for vaccine literacy research.
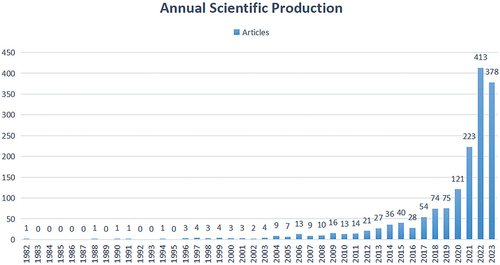
Table 1. Top 10 countries with the most publications and citations.
Figure 2. Co-authorship network among countries with more than five publications.
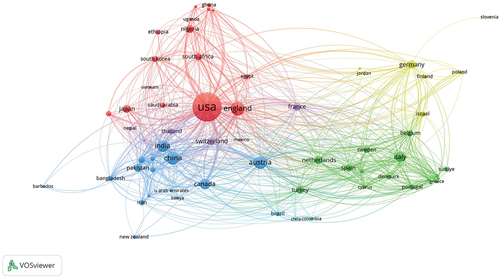
Table 2. Top 10 authors with the most publications and citations.
Figure 3. Three-field plot between the top 20 most productive authors (left), countries (center), and organizations (right).
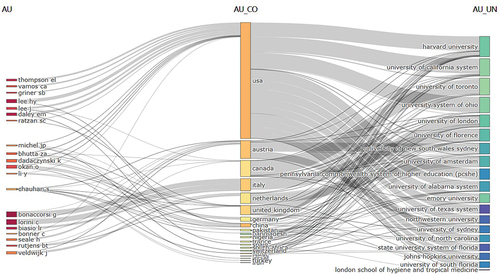
Figure 4. Source dynamics of the top five productive journals.
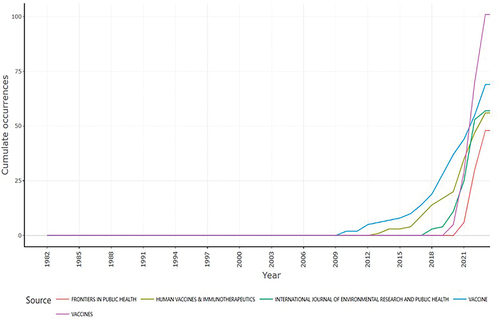
Figure 5. The citation network of the most-cited publications.
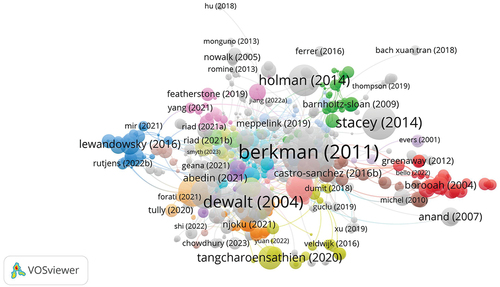
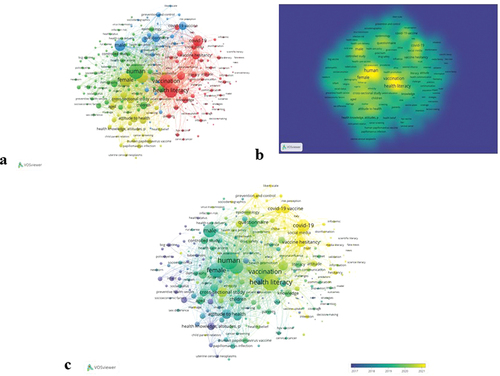
Figure 6. Co-occurrence analysis of keywords. The network (a), density (b), and overlay (c) visualization map of keywords of vaccine literacy research.
Supplementary Material.docx
Download MS Word (556 KB)Data availability statement
The data that support the findings of this study are available from the corresponding author, upon reasonable request.