
Figures & data
Figure 1. Flow chart.
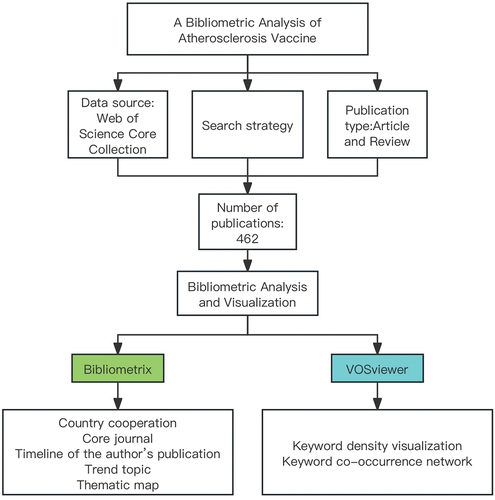
Figure 2. Analysis of annual publications a) Main information. b) Analysis of annual scientific production.
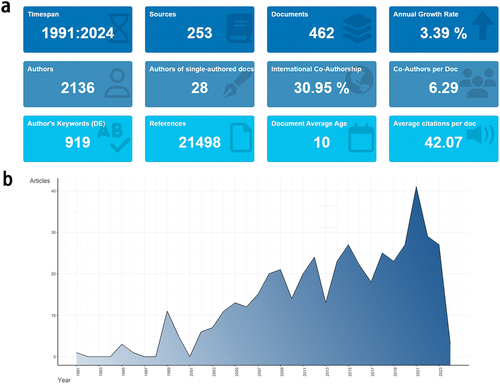
Figure 3. Distribution map of countries. a) the Country collaboration map. b) the proportion of SCP and MCP in the top ten countries ranked by publication output. SCP: single country publications. MCP: multiple country publications.
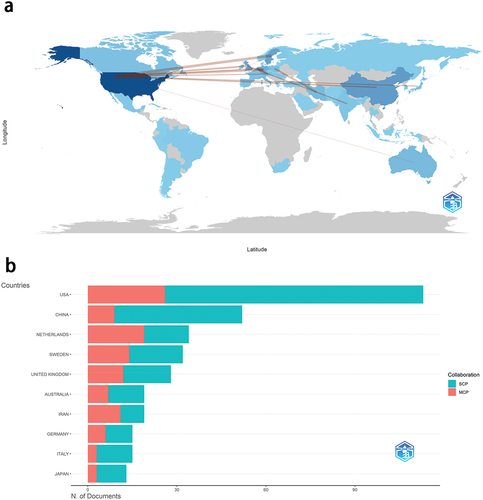
Table 1. Top 10 contributing countries/regions related to atherosclerosis vaccine.
Figure 4. Distribution map of authors. a) Three-Field Plot-country, institution, author. b) Author’s production over time.
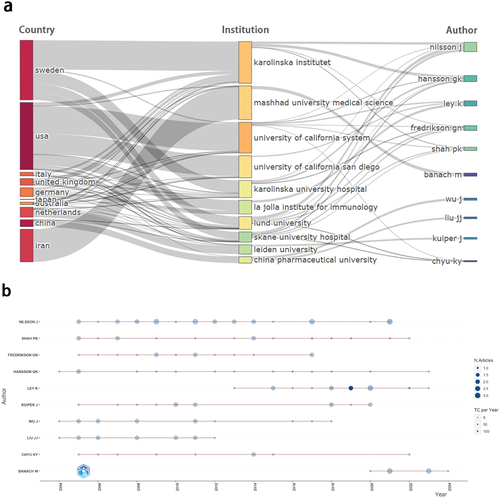
Table 2. The most influential authors in the field of atherosclerosis vaccine.
Figure 5. Core sources by Bradford’s Law. The vertical axis: number of articles, the horizontal axis: journals.
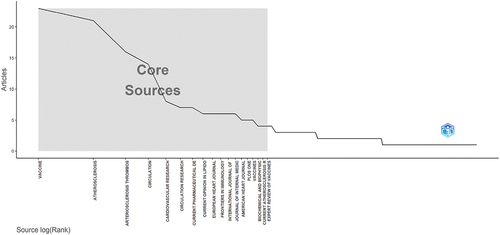
Table 3. The top 10 journals related to atherosclerosis vaccine.
Table 4. Top 10 highest citation publications in the field of atherosclerosis vaccine.
Figure 6. Visualization of keywords. a) the density visualization of keywords. b) the cluster map of keywords.
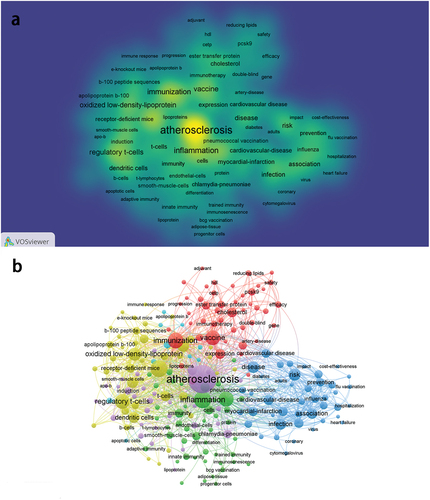
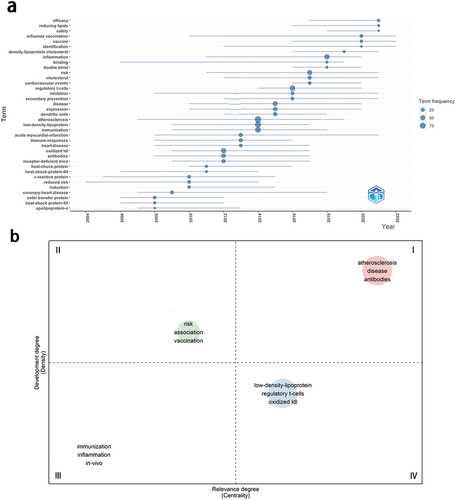
Figure 7. Theme analysis map. a) Trend topic map. b) Thematic map.
Data availability statement
The data supporting the results of this study can be obtained from the corresponding authors upon reasonable request.