Figures & data
Figure 1. Flowchart diagrams of design and study selection procedure.
Figure 2. Flowchart of treatment regimens used in the studies papers.
Table 1. Characteristic of included studies.
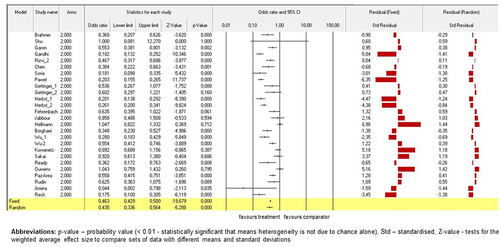
Figure 3. The model of drug-based network and TEAEs. Fixed-effect and randomised-effect models on the study arms subgroups containing the total number of TEAEs. Forrest plots depict the risk ratio of the favourable treatments versus comparators. The standardised residuals of both models are displayed.
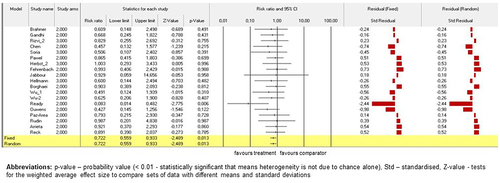
Figure 4. The model of drug-based network and TEAEs. Fixed-effect and randomised-effect models on the study arms subgroups grouped by these subgroups containing the total number of TEAEs. Forrest plots depict the risk ratio of the favourable treatments versus comparators. The standardised residuals of both models are displayed.
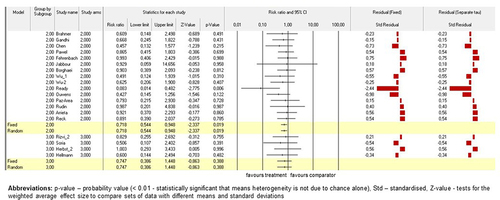
Figure 5. The model of drug-based network and TEAEs. Fixed-effect and randomised-effect models on the study arms subgroups containing the total number of TEAEs were moderated by CTCEA Grade (G-I against G-II). The models were grouped by CTCEA Grade and heterogeneity values was provided because of an analysis being run within each grade and an overall analysis across these grades as well as within groups and between groups. Forrest plots depict the risk ratio of the favours treatments versus comparators. The standardised residuals of both models are displayed.
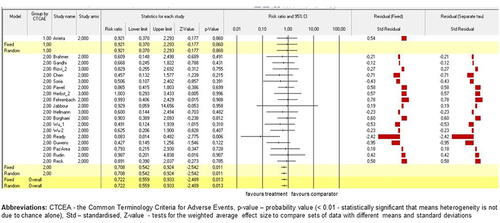
Figure 6. Model on survival compared by CIP between studies. Fixed-effect and randomised-effect models on clinical trials (n=38) containing survival were compared by the presence of CIP. Forrest plots depict the risk ratio of the favours treatments versus comparators. The standardised residuals of both models are displayed.
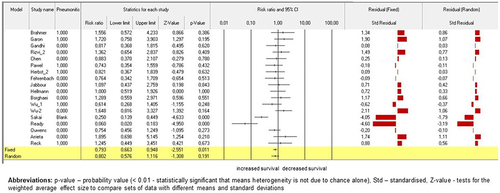
Figure 7. Model on survival compared by ICI treatment effect. Fixed-effect and randomized-effect models containing quantifying the ICI treatment effect across studies using survival data by the log hazard rate. Forrest plots depict the risk ratio of the favorable treatments versus comparators. The standardized residuals of both models are displayed.
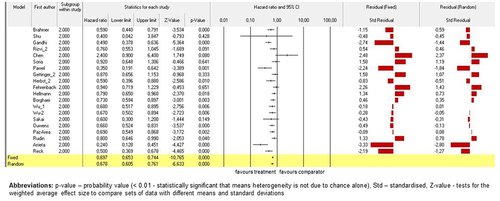
Figure 8. Models on survival compared by mortality across studies. Fixed-effect and randomised-effect models on mortality across studies investigated the total number of deaths in ICI subgroup against conventional drugs. Forrest plots depict the risk ratio of the favours treatments versus comparators. The standardised residuals of both models are displayed.