
Figures & data
Table 1. Experimental design.
Figure 1. Schematic overview of immunizations and sample collections. A total of 27 rhesus macaques were randomly divided into four groups and assigned to receive either intranasal or intramuscular immunization. The vaccine was formulated with either 10, 100, or 200 µg of LecA plus adjuvant and was administered to designated groups accordingly. Each group received three immunizations with a 3-week interval. Pre-immune samples (blood, saliva, stool, and PBMCs) were collected 1 week prior to the first vaccination, and samples were collected thereafter at the time points shown. Approximately 8-9 months after the third immunization, three animals were euthanized to collect lymph nodes, bone marrow, splenocytes, and PBMCs. Animal health was monitored continuously with regular blood and physical examinations. *Week 41 is an approximate time point representing B and T cell ELISpot assays conducted on tissues harvested from three animals that underwent necropsy 8-9 months after the third immunization, as well as B and T cell ELISpot assays conducted on PBMCs collected 10 months after the third immunization from remaining animals.
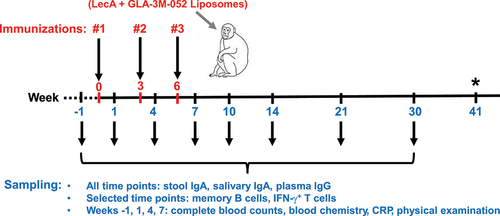
Figure 2. LecA vaccine elicited a strong systemic antibody response. (a) Anti-LecA plasma IgG endpoint titers. Each group (n = 7 or 6) was immunized three times either intranasally or intramuscularly at a 3-week interval with LecA+GLA-3M-052 liposome formulation. Pre-immune samples collected a week prior to the first immunization served as a negative control. Samples were then collected at the time points noted in (Weeks 1, 4, 7, 10, 14, 21, and 30). All plasma samples were serially diluted and analyzed for LecA-specific antibody levels by ELISA. Any OD value ≤ 0.5 at a 1:8000 dilution of plasma was considered as negative/background based on the pilot runs. Endpoint titers were plotted for all the time points. A plasma sample from an infected human individual collected 28 d after PCR positive detection (human control) as well as a sample from a naturally infected animal (nat. infected) from the same colony identified during the pre-immunization screening were used as positive controls. Plasma from healthy human individuals or naïve animals acted as negative controls and showed background signal (not shown). Data are represented as mean ± SD. (b) Regression analysis. Same data plotted after adjusting for age, sex, and weight. (c) Integrated AUC analysis. Data are represented as mean ± SEM. (d) Avidity index. Plasma dilutions that gave an OD450 nm = 1.0 were determined using Week 10 samples. ELISAs for anti-LecA IgG titers were run as described in two plates in parallel. One plate received standard PBST washes, while the other was washed using 6 M urea. Avidity Index (AI %) was expressed as follows: AI = [(absorbance of urea-treated sample/absorbance of non-urea-treated matched sample) × 100]. All samples were run in triplicate. Data are represented as mean ± SD.
![Figure 2. LecA vaccine elicited a strong systemic antibody response. (a) Anti-LecA plasma IgG endpoint titers. Each group (n = 7 or 6) was immunized three times either intranasally or intramuscularly at a 3-week interval with LecA+GLA-3M-052 liposome formulation. Pre-immune samples collected a week prior to the first immunization served as a negative control. Samples were then collected at the time points noted in Figure 1 (Weeks 1, 4, 7, 10, 14, 21, and 30). All plasma samples were serially diluted and analyzed for LecA-specific antibody levels by ELISA. Any OD value ≤ 0.5 at a 1:8000 dilution of plasma was considered as negative/background based on the pilot runs. Endpoint titers were plotted for all the time points. A plasma sample from an infected human individual collected 28 d after PCR positive detection (human control) as well as a sample from a naturally infected animal (nat. infected) from the same colony identified during the pre-immunization screening were used as positive controls. Plasma from healthy human individuals or naïve animals acted as negative controls and showed background signal (not shown). Data are represented as mean ± SD. (b) Regression analysis. Same data plotted after adjusting for age, sex, and weight. (c) Integrated AUC analysis. Data are represented as mean ± SEM. (d) Avidity index. Plasma dilutions that gave an OD450 nm = 1.0 were determined using Week 10 samples. ELISAs for anti-LecA IgG titers were run as described in two plates in parallel. One plate received standard PBST washes, while the other was washed using 6 M urea. Avidity Index (AI %) was expressed as follows: AI = [(absorbance of urea-treated sample/absorbance of non-urea-treated matched sample) × 100]. All samples were run in triplicate. Data are represented as mean ± SD.](/cms/asset/798b4049-8a6e-471c-8b35-e8577c26c235/khvi_a_2374147_f0002_oc.jpg)
Figure 3. Mucosal antibody response. Each group (n = 7 or 6) was immunized three times either intranasally or intramuscularly at a 3-week interval with LecA+GLA-3M-052 liposome formulation. Pre-immune samples collected a week prior to the first immunization served as negative controls. Samples were then collected at the time points noted in (Weeks 1, 4, 7, 10, 14, 21, and 30). All samples were serially diluted and analyzed for LecA-specific antibody levels by ELISA. Any OD value ≤ 0.1 at a 1:2 dilution of stool supernatant or an OD value ≤ 0.1 at a 1:5 dilution of saliva was considered as negative/background based on the pilot runs. Endpoint titers were plotted for all the time points. (a) Stool IgA endpoint titers. Stool supernatants were prepared as described under methods. A stool sample from an infected human individual collected 28 d after PCR positive detection (human control) was used as a positive control. Samples from healthy human individuals or naïve animals acted as negative controls and showed background signal (not shown). Data are represented as mean ± SD. (b) Regression analysis for stool IgA. Data plotted after adjusting for age, sex, and weight. (c) Integrated AUC analysis of stool IgA. Data are represented as mean ± SEM. (d) Salivary IgA endpoint titers. Saliva samples were not processed after collection. Data are represented as mean ± SD. (e) Regression analysis for salivary IgA. Data plotted after adjusting for age, sex, and weight. (f) Integrated AUC analysis of salivary IgA. Data are represented as mean ± SEM.
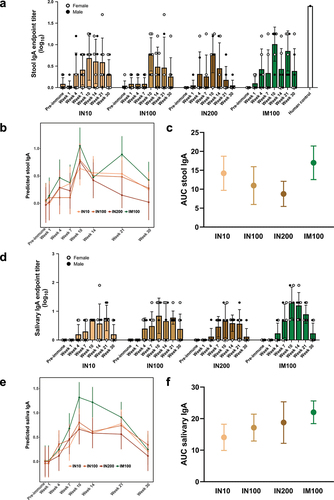
Figure 4. Plasma, stool, and salivary antibodies exhibited adherence inhibitory activity. E. histolytica trophozoites were incubated on ice for 1 h with pre-immune or immune plasma, stool supernatant, or saliva samples from the IN100 and IM100 groups collected at Week 10. The mixtures were then incubated on ice with Chinese hamster ovary (CHO) cells at a 1:20 ratio for 1.5 h and centrifuged. Pellets were used to score rosette formation under microscope. (a) Plasma. (b) Stool supernatant. (c) Saliva. Data are represented as mean ± SD. Data were plotted and analyzed using ANOVA in Prism 9.0. Pre-immune samples from both delivery routes were plotted together. Control = amebae + CHO cells only, Gal = galactose control as a competitive inhibitor, human = sample from anti-LecA plasma IgG+/stool IgA+ individual. *p < .05, **p < .01, ****p < .0001.
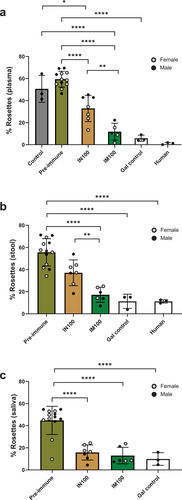
Figure 5. LecA vaccine generated systemic recall responses for T and B cells. (a) LecA-specific IFN-γ+ T cell response. Fresh PBMCs were isolated from blood collected at approximately Week 41 (see ) and stimulated for 48 h with purified recombinant LecA protein in triplicate. Stimulation using anti-CD3 antibodies was used as a positive control, and unstimulated cells were used as a negative control. Spots were counted and expressed as spot forming units (SFU) per million after log-transforming the data. Background signal from unstimulated wells was subtracted and was typically <100 SFU/million. See also Supplementary Figure 1 (b–c) LecA-specific long-term IgG and IgA antibody-secreting cell (ASC) responses in both intranasal and intramuscular regimens. ELISpot assay was used to compare antibody-secreting BMEM between intranasal and intramuscular regimens. PBMCs were isolated from blood collected at the Week 14 time point and activated with B cell activator (R848/IL-2) for 72 h. All cells were then cultured in triplicate on LecA-coated plates for an additional 16–24 h. Pre-immunization PBMCs from the same animals were used to measure baseline response, which was subtracted from the test readings. Spots were developed, counted, and plotted as SFU per million after log-transforming the data. (b) LecA-specific IgG-secreting BMEM, (c) LecA-specific IgA-secreting BMEM. One animal in the IM100 group did not have enough cells. The Mann–Whitney test was used in GraphPad Prism to compare groups. Data are represented as mean ± SD. *p < .05, **p < .01.
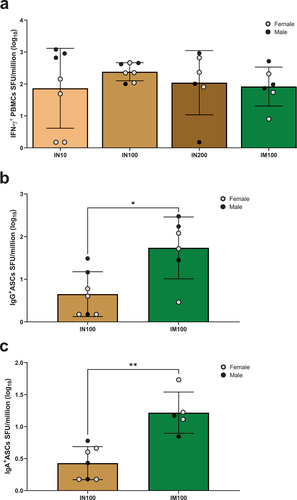
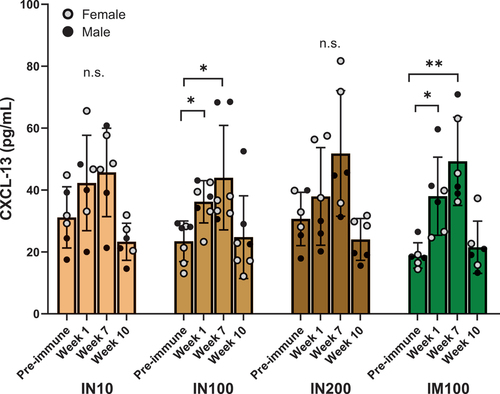
Figure 6. CXCL-13 as a plasma biomarker for germinal center activity. Circulating CXCL-13 levels were determined using a commercial ELISA kit (Bio-Techne) according to the instructions provided. Neat plasma samples at the indicated time points from each group were used in triplicate, and CXCL-13 concentrations were extrapolated using the standard curve. All the values were in the linear range of the curve. ANOVA was used to analyze the data in GraphPad Prism. One outlier identified by Grubb’s test was removed from the IN10 group. Data are represented as mean ± SD. *p < .05, **p < .01.
NHP_SupplInfo_HVI_2024_06_14_clean.docx
Download MS Word (479 KB)Data availability statement
The datasets generated during and/or analyzed during the current study are available from the corresponding author on request.