Figures & data
Table 1. Characterization of protein sequences of 12 SlDDP gene family members in tomato genome
Figure 1. Circos plot showing the physical location of 12 DDP genes distribution in 12 tomato chromosomes, including chromosome 0 (for unallocated genes). The segmental duplication pairs are marked with blue color. The color lines in the circus plot indicate SlDDP segmental duplication between different chromosomes, including SlDDP3-SlDDP8, SlDDP7-SlDDP11, and SlDDP6-SlDDP12. The scale at the top of each chromosome indicates the size of the chromosome in MBs.
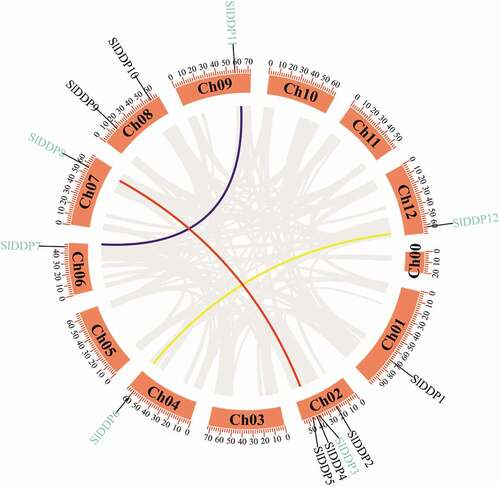
Figure 2. Phylogeny of DDPs gene family. An unrooted neighbor-joining (NJJ) phylogenetic tree of (a) tomato SlDDPs and (b) with Arabidopsis DDPs were generated using MEGA 7 program. The bootstrap was set at 1000 replicates. All the DDPs were clustered into four clades named I, II, III, and IV.

Figure 3. Gene structure analysis of tomato DDPs. (a) The number and distribution of exons and introns and (b) conserved motifs in SlDDPs identified using GSDS and MEME tools, respectively. The scale at the bottom is represented in Kb.
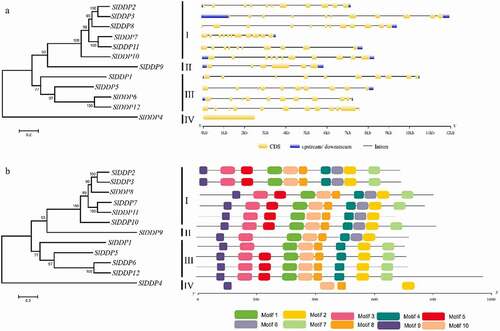
Figure 4. Predicted putative cis-regulatory elements in promoter regions of tomato DDP gene family members. TGA-element; Auxin-responsive element, ABRE; cis-acting element involved in the abscisic acid responsiveness, CGTCA/TGACG-motif; cis-acting regulatory element involved in the MeJA-responsiveness, ERE; Ethylene-responsive element, ABRE; involved in ABA responsiveness, LTR; cis-acting element involved in low-temperature responsiveness, AuxRR-core; cis-acting regulatory element involved in auxin responsiveness, TATC-box/GARE-motif; gibberellin-responsive element. A promoter sequence up to 2000 bp from 5`UTR was retrieved from SNG and submitted to PlantCARE database for cis-regulatory elements prediction.
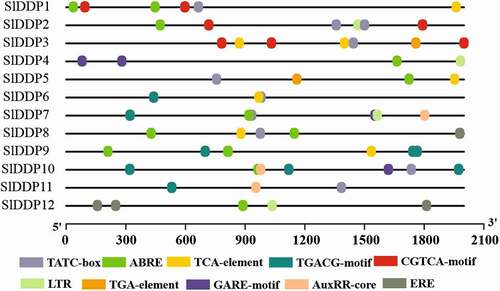
Figure 5. Tissue/organ-specific expression of SlDDPs in tomato. Expression profile of 12 SlDDPs in various plant parts, including root, leaf, flower, and fruits. FF; Fully opened flowers, FB; Flower bud, 1/2/3 cm_F; 1/2/3cm fruit, MG_F; Mature green fruit, B_F; Breaker fruit, and B10_F; ten days Breaker fruit. Heatmap was generated using logCitation2 transformed RT-qPCR values.
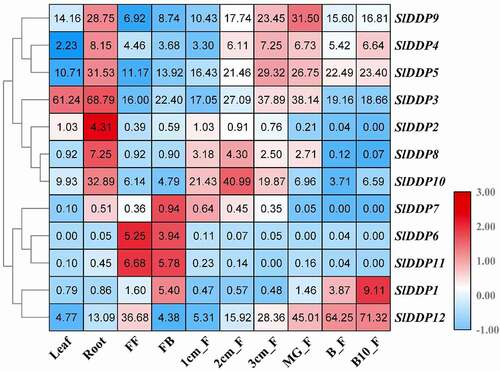
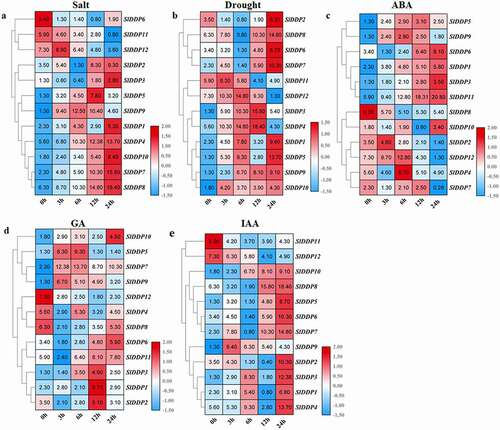
Figure 6. Expression analysis of SLDDPs under salinity, drought, and Phytohormones. Heatmap showing expression profile of 12 SlDDPs under (a) salt, (b) drought (PEG), (c) Abscisic acid (ABA), (d) Gibberellin (GA3), and (e) Auxin (IAA) at 0 h, 3 h, 6 h, 12 h, and 24 h time points. Plants at 0 h time interval were used as control. Heatmap was generated using logCitation2 transformed RT-qPCR values.