Figures & data
Figure 1. Diagram representing the pFGC5941 plant expression vector that was used to transform sesame plants. The vector contain the bar selectable marker LB: left border repeat from nopaline C58 T-DNA; Kanamycin resistance (KanR) gene for bacterial selection, a basta resistance (BAR) gene for plant selection, a CaMV 35S promoter followed by multiple cloning sites, and a 1,352 bp ChsA intron (from the petunia Chalcone Synthase A gene) to stabilize the inverted repeat of the target gene fragment. RB: right border repeat from nopaline C58. T-DNA (the map was created by SnapGene).
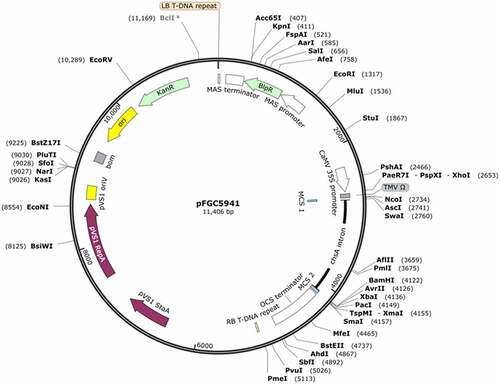
Figure 2. Different stages of transformation of sesame. a) De-coated sesame seeds 48 hr after co-cultivation with Agrobacterium tumefaciens, the seeds are placed on germination medium; b) potential transgenic sesame seeds after being transplanted into trays filled with soil mix in the greenhouse; c) transplanting of successful PCR-positive individuals in bigger pots “plant height 10 cm long”; d) and e) growth of PCR-positive transgenic individual “50 cm and 90 cm, respectively; f) transgenic individual plants reaching flowering and seed setting in greenhouse; g) PCR screening of putative T0 plants from 6, 12, and 18 weeks old plants by 35s primer which amplified 200 bp. M: 100bp ladder DNA marker, lane 1: negative control: water, lane 2: negative control (non-transgenic plant), lane 3: positive control (pFGC5941 RNAi vector), and other lanes transgenic plants.
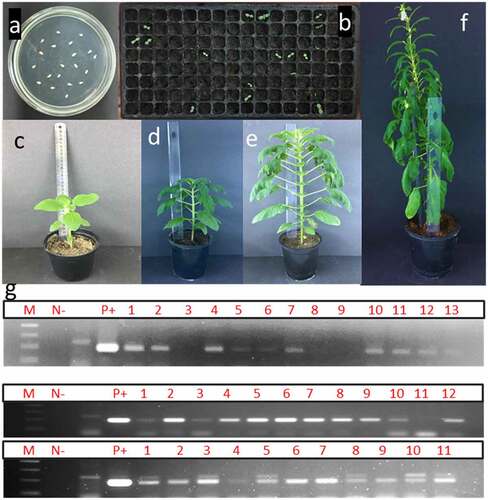
Figure 3. Different developmental stages of putative transgenic sesame plants. a) flowering initiation in sesame plants about 45 days post transformation; b) flowering in putative transgenic sesame plants 65 days post transformation; c) transgenic individual plants reaching seed-setting under greenhouse conditions; and d) PCR-screening of putative transgenics sesame plants using flower-tissues by 35 s primer. M: 100bp ladder DNA marker, lane 1: negative control: water, lane 2: negative control (non-transgenic plant), lane 3: positive control (pFGC5941 RNAi vector), and lane from 4 to 11 transgenic plants.
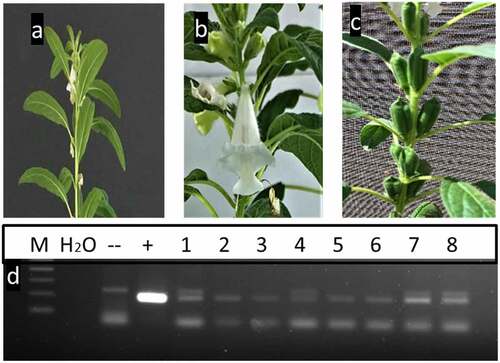
Figure 4. PCR screening of putative transgenic T1 plants from two different lines using 35S primer and bar primers which amplified 200 and 247bp fragments, respectively. a and b using 35S primer lane 1: negative control: H2O, lane 2: negative control (non-transgenic plant), lane 3: positive control (pFGC5941 RNAi vector), and other lanes transgenic plants. c and d using bar primer lane 1: negative control (water), lane 2: negative control (non-transgenic plant), lane 3: positive control (pFGC5941 RNAi vector), and from lane 4 to lane 14 transgenic plants. M: 100bp ladder DNA marker.
Figure 5. Effect of basta leaf-painting and spraying on sesame plants exhibiting a varying degree of bar gene expression five days post-treatment (0.02% Basta). a. basta-leaf painting derived from transgenic plants (1, 3, 5, and 7) and non-transgenic segregant plants (2, 4, 6, and 8) b. Full-plant spraying with Basta (1) control plant, (2) non-transformed azygous plant, (3) transgenic non-treated plant, and (4) transgenic sprayed plant.
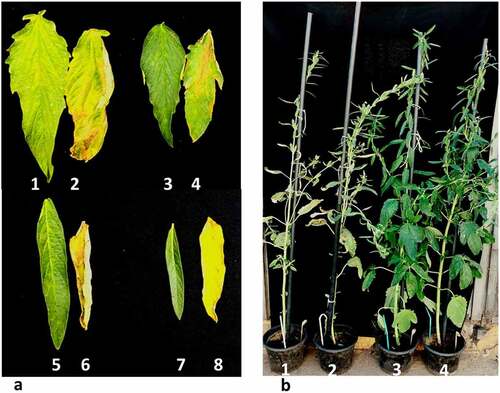
Figure 6. Reverse transcriptase reaction using the bar and nptII primers for RNA samples from T1 sesame plants. a) using bar primer lane 1: negative control (water), lanes 2, 4, and 6: T1 transgenic samples produced a 247bp fragment, lane 3: positive control (pFGC5941 RNAi vector), and lanes 5 and 7: are –RT lines. b) using nptII primer lane 1: negative control (water), lane 2: negative control (non-transgenic plant), lane 3: positive control (pFGC5941 RNAi vector), lanes 4 and 5: RT (transgenic plants from lanes 4 and 6 in the previous gel). M: 100 bp ladder DNA marker, positive sample produced a 680 bp fragment.