Figures & data
Figure 1. Total market index EU
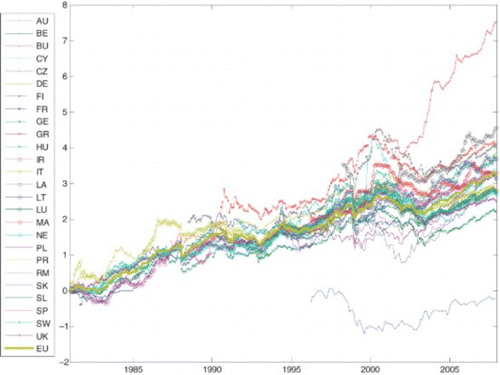
Table 1. Average cross-sectional correlations
Table 2. Average cross-sectional correlations: (a) returns and (b) level
Table 3. EU 27 countries
Figure 2. Cross-sectional covariance of (a) convergent groups and (b) nonconvergent groups
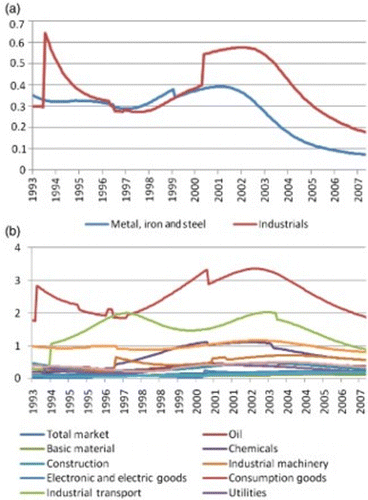
Table 4. EMU 11 countries
Figure 3. Cross-sectional covariance of (a) convergent groups EMU and (b) nonconvergent groups EMU
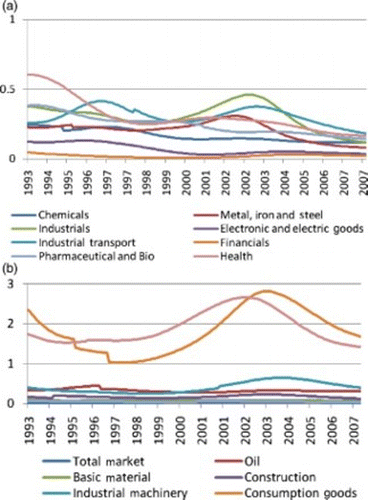
Table 5. Cluster analysis summary
Figure 4. Clusters
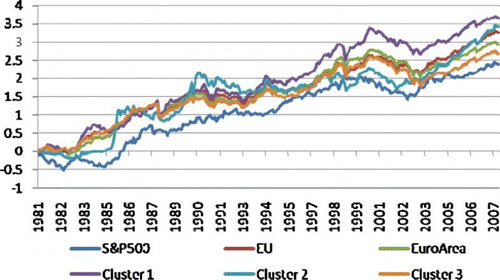
Table 6. Club convergence in equity markets
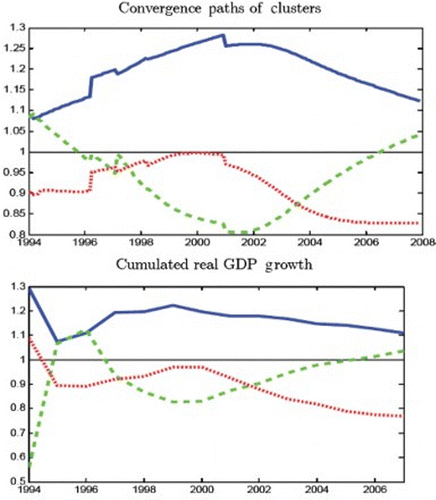
Figure 5. Cluster convergence and economic fundamentals
Notes: The top panel shows the cluster convergence paths with respect to the EU average. The bottom panel plots the cumulated annual growth rates (data source: the Conference Board and Groningen database). The blue line refers to cluster 1, the green line refers to cluster 2 and the dotted red line refers to cluster 3.