Figures & data
Figure 1. Number of points awarded versus weekly wages.
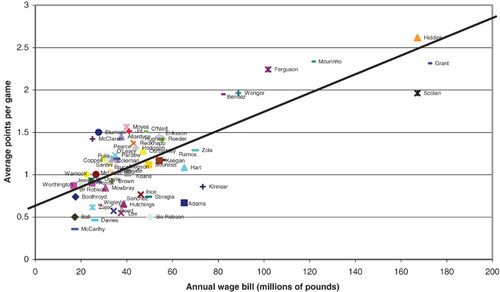
Table 1. Estimation results for model including team characteristics and manager fixed effects
Table 2. Manager performance according to the bootstrap approach
Table 3. A list of managers sacked (left panel) and resigned (right panel) from EPL teams 2004–2009
Figure 2. Bootstrap results for Arsène Wenger.
Note: The figure plots the percentage of times that the manager was outperformed by a randomized manager in the recursive bootstrap.
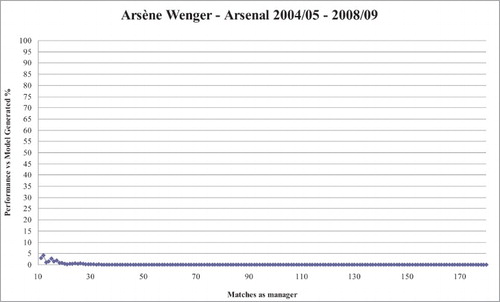
Figure 3. Bootstrap results for Martin Jol.
Note: The figure plots the percentage of times that the manager was outperformed by a randomized manager in the recursive bootstrap.
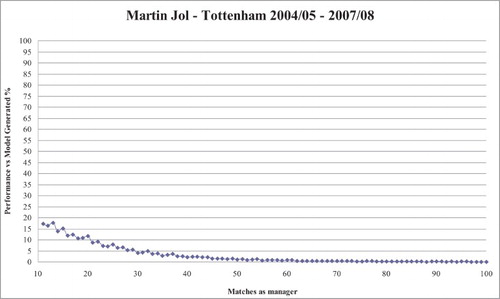
Figure 4. Bootstrap results for Graeme Souness.
Note: The figure plots the percentage of times that the manager was outperformed by a randomized manager in the recursive bootstrap.
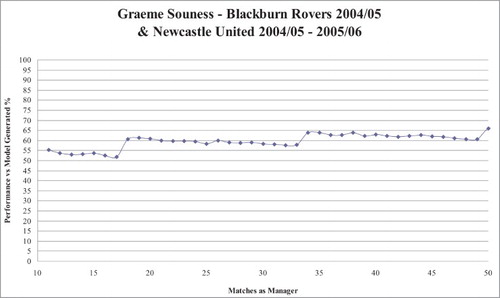
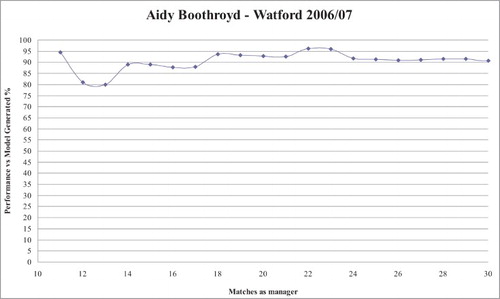
Figure 5. Bootstrap results for Aidy Boothroyd.
Note: The figure plots the percentage of times that the manager was outperformed by a randomized manager in the recursive bootstrap.