Figures & data
Table 1. First market price of risk ϕ1 with respect to the observable trend and average shape of the initial forward rate curve.
Table 2. Market prices of risks ϕ1 and ϕ2 with respect to the observable trend.
Figure 1. Forward LIBOR in Japanese LIBOR/swap market from 2 April 2007 to 31 August 2009, where xi = 0, 2, 5, 10 years. Period A is from 2 April 2007 to 16 June 2008, period B is from 16 June 2008 to 31 August 2009. The swap data are provided by Mizuho Information and Research Institute.
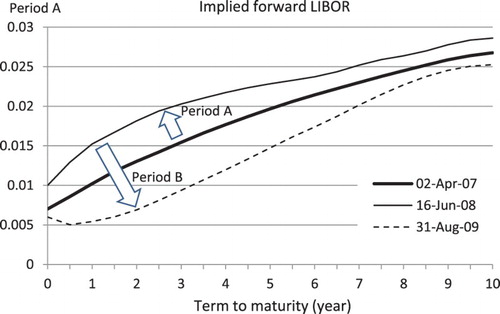
Figure 2. Implied forward LIBOR curves at three days (2 April 2007, 16 June 2008, and 31 August 2009). The observable trend is bear flat in period A and bull steep in period B.