7,273
Views
6
CrossRef citations to date
0
Altmetric
Articles

Public participation and satisfaction in urban regeneration projects in Tanzania: The case of Kariakoo, Dar es Salaam

&
Pages 68-87 | Received 29 Dec 2014, Accepted 15 Apr 2015, Published online: 13 Jul 2015

Figures & data

Figure 1. Determinants of participation.

Source: Layson, Citation2014.
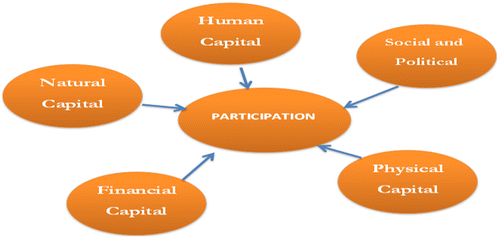
Figure 1. Determinants of participation.Source: Layson, Citation2014.

Figure 2. Linkage between community participation, public satisfaction, and sustainability.

Source: created by the authors.
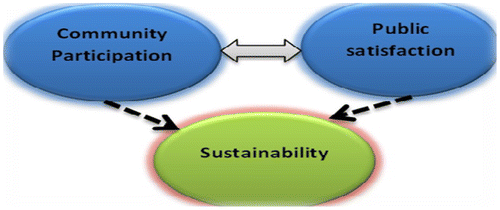
Figure 2. Linkage between community participation, public satisfaction, and sustainability.Source: created by the authors.

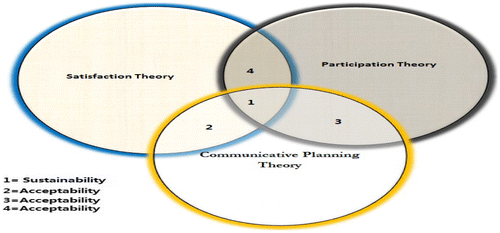
Figure 3. Conceptual theory on sustainability.

Source: created by the authors.

Figure 3. Conceptual theory on sustainability.Source: created by the authors.

Figure 4. Map of Tanzania showing location of Dar es Salaam.

Source: Layson, Citation2014.
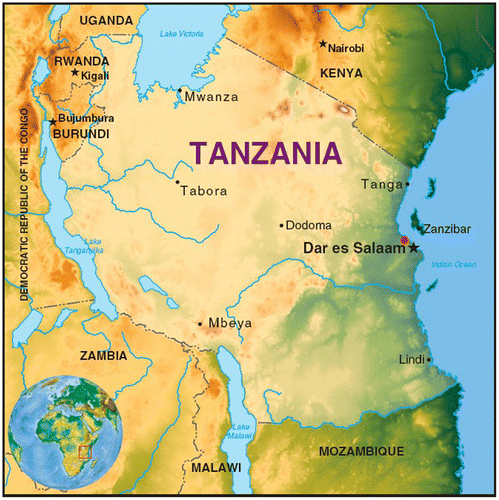
Figure 4. Map of Tanzania showing location of Dar es Salaam.Source: Layson, Citation2014.

Figure 5. Map of Dar es Salaam showing districts and location of Kariakoo.

Source: Layson, Citation2014.
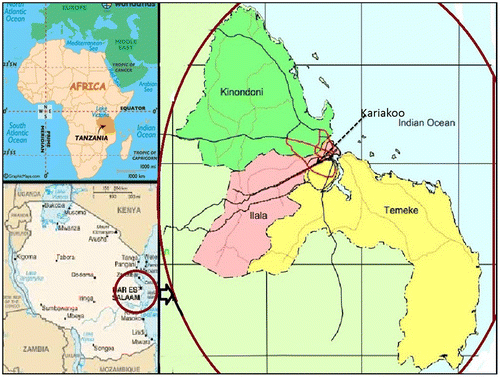
Figure 5. Map of Dar es Salaam showing districts and location of Kariakoo.Source: Layson, Citation2014.

Figure 6. Location of Kariakoo in Dar es Salaam city.

Source: United Republic of Tanzania, Dar es Salaam master plan, 2012.
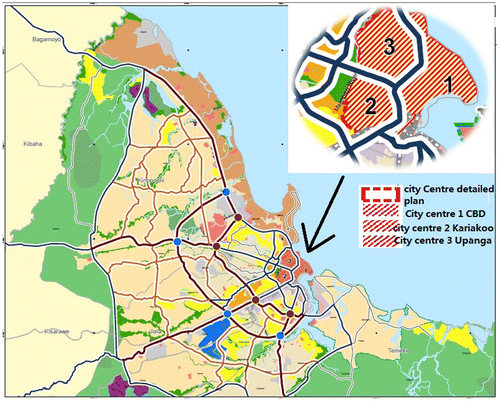
Figure 6. Location of Kariakoo in Dar es Salaam city.Source: United Republic of Tanzania, Dar es Salaam master plan, 2012.

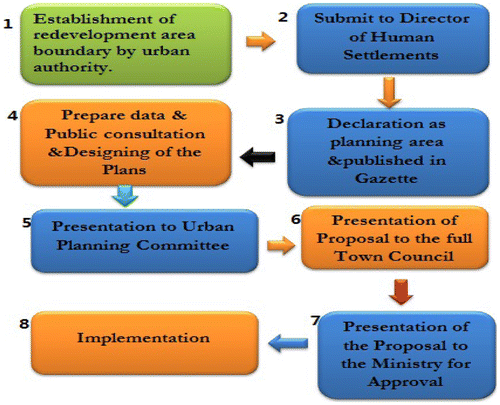
Figure 7. Procedures for preparation of urban renewal/redevelopment plans.

Source: author.

Figure 7. Procedures for preparation of urban renewal/redevelopment plans.Source: author.

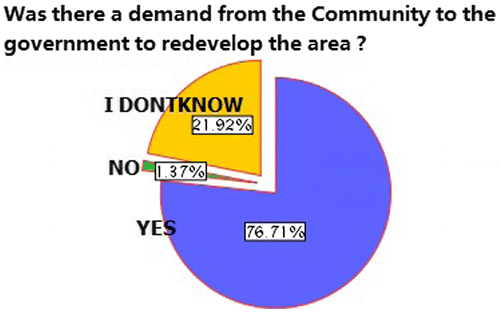
Figure 8. Assessing demand for project initiation.

Figure 8. Assessing demand for project initiation.

Table 1. Cross-tabulation of tenure status with gender.

Table 2. Duration of respondents residing in the area.

Figure 9. ANOVA, comparison on level of education and awareness.

Figure 9. ANOVA, comparison on level of education and awareness.

Table 3. Respondents’ awareness of Kariakoo urban redevelopment.

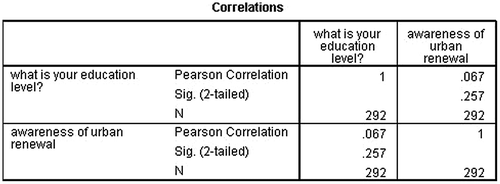
Figure 10. Correlation between level of education and awareness on urban renewal/redevelopment.

Figure 10. Correlation between level of education and awareness on urban renewal/redevelopment.

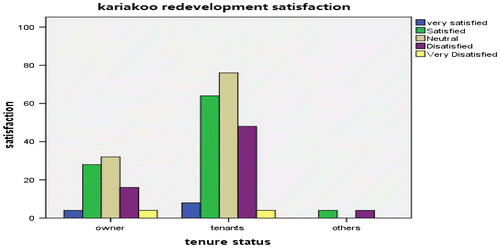
Figure 11. Satisfaction assessment based on housing ownership.

Figure 11. Satisfaction assessment based on housing ownership.

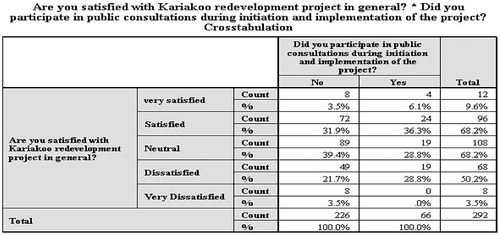
Figure 12. Cross-tabulation of project satisfaction and participation.

Figure 12. Cross-tabulation of project satisfaction and participation.

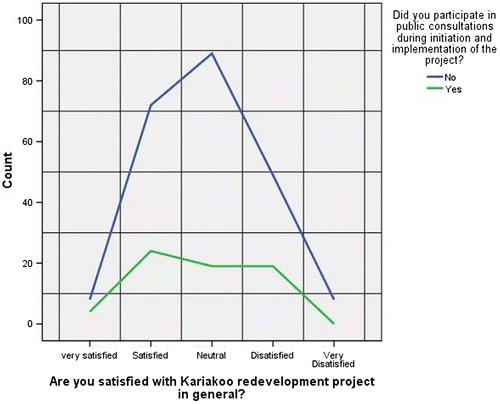
Figure 13. A graph of relation between participation and satisfaction.

Figure 13. A graph of relation between participation and satisfaction.

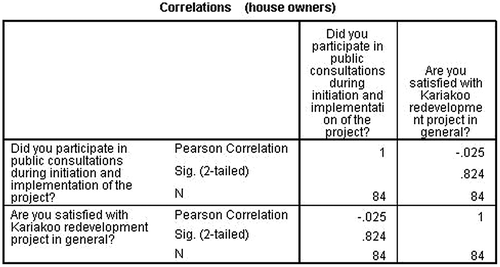
Figure 14. Correlation between participation and awareness on urban renewal/redevelopment.

Figure 14. Correlation between participation and awareness on urban renewal/redevelopment.