Figures & data
Figure 1. Links considered for the analysis.
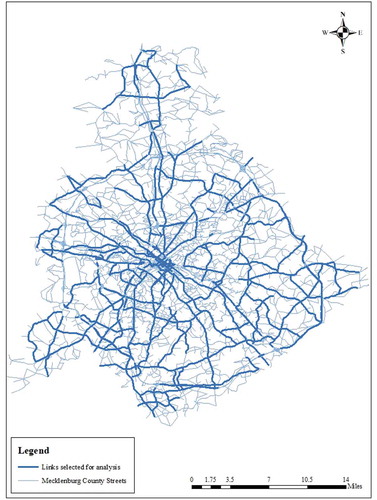
Figure 2. Distribution of the selected links by the speed limit.
Figure 3. Distribution of the selected links by the area type.
Table 1. Mean and standard deviation by time of the day – all links.
Table 2. Mean and standard deviation by time of the day and speed limit.
Table 3. Mean and standard deviation by time of the day and area type.
Figure 4. Scatter plots for the links with speed limit > 50 mph by time of the day.
Figure 5. Scatter plots for the links with speed limit > 40 & ≤ 50 mph by time of the day.
Figure 6. Scatter plots for the links with speed limit >30 & ≤40 mph by time of the day.
Figure 7. Pearson correlation coefficients – for all links.
Figure 8. Pearson correlation coefficients – for links with speed limit >50 mph.
Figure 9. Pearson correlation coefficients – for links with speed limit >40 & ≤ 50 mph.
Figure 10. Pearson correlation coefficients – for links with speed limit >30 & ≤40 mph.
Figure 11. Pearson correlation coefficients by area type.