
Figures & data
Figure 1. Example links – ramp to the next ramp or major intersection to the next major intersection.
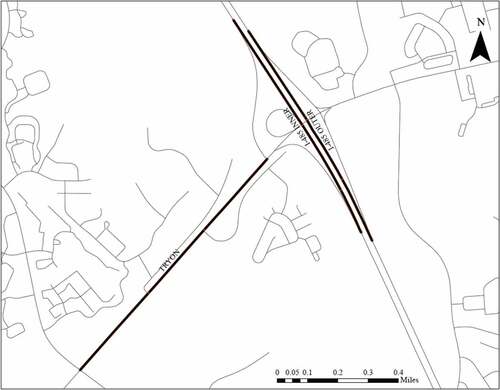
Figure 2. Selected links in Mecklenburg County and Iredell County.
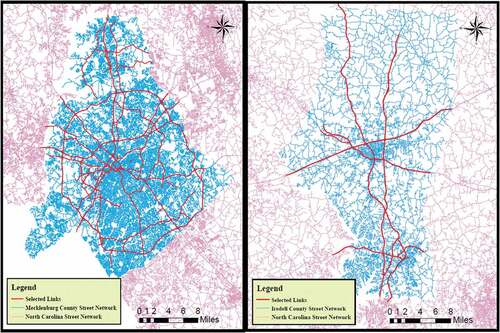
Table 1. Data Samples for GEE Modeling by Reference Speed, DOW, and TOD
Table 2. Pearson Correlation Coefficient Matrix
Table 3. GEE Model – The ATT of Trucks to the ATT of Passenger Cars Ratio
Table 4. GEE Model – The ATT of Trucks to the ATT of Traffic Stream Ratio