
Figures & data
Figure 1. Wandel’s three-layer model.
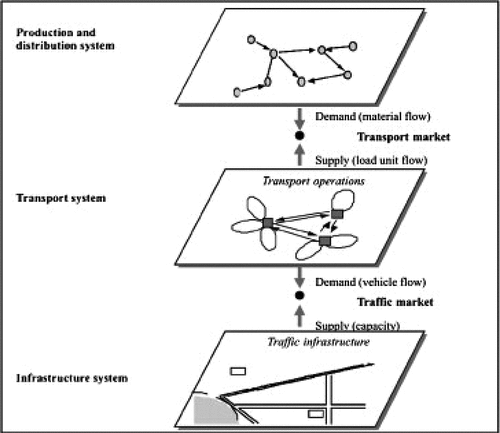
Figure 2. Nigeria’s rail network.
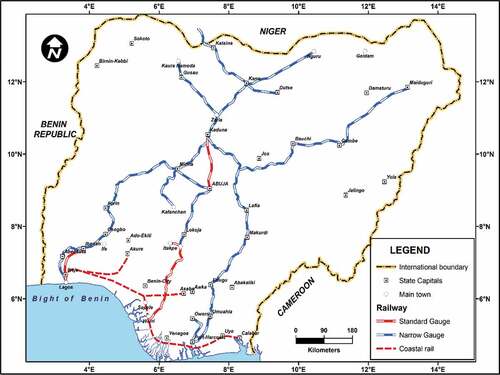
Figure 3. Nigeria’s road network.
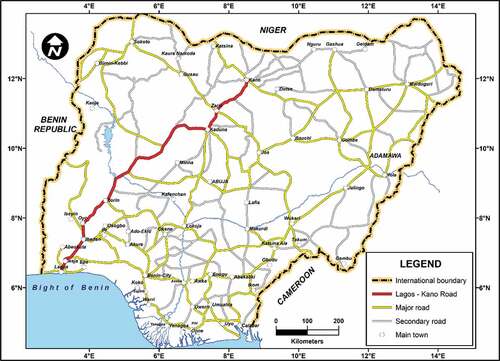
Table 1. Road and rail freight charges
Table 2. Cost components of road freight rates
Table 3. Energy use by trucks and trains
Table 4. Performance measures in Nigeria’s land transport (Lagos–Kano corridor)
Figure 4. Monthly freight flows by rail.
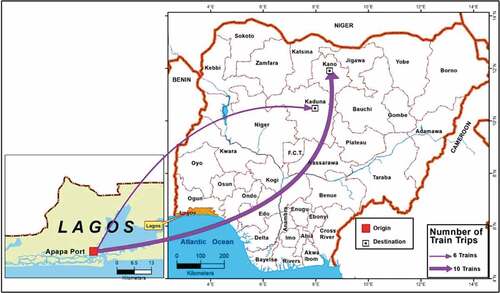
Figure 5. Monthly freight flows by road.
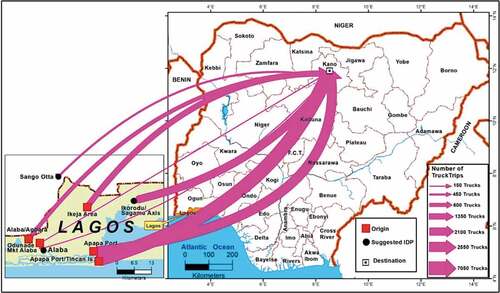
Figure 6. Freight flows by road and rail on Lagos–Kano (2017) depicted in three-layer mode.
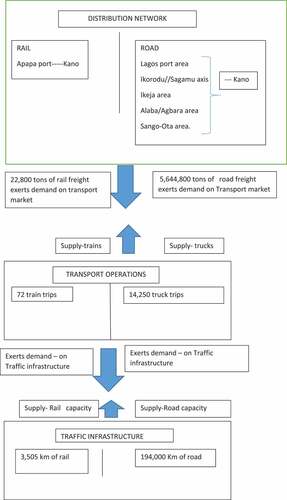

Table 1. DESTINATIONS AND MAJOR FREIGHT TYPES ON IDDO-KAJOLA ROUTE
Table 2: FREIGHT LOAD FACTORS
Table 3. Non Scheduled Train Operations
Table 4. FREIGHT TRANSPORT TIME

Supplemental material