Figures & data
Table 1. Descriptive statistics of CaBi variables by quarter of the 2019 and 2020 years
Table 2. Descriptive statistics of COVID-19 variables by quarter of the 2020 year
Figure 1. Daily CaBi trips and COVID-19 cases and patients.
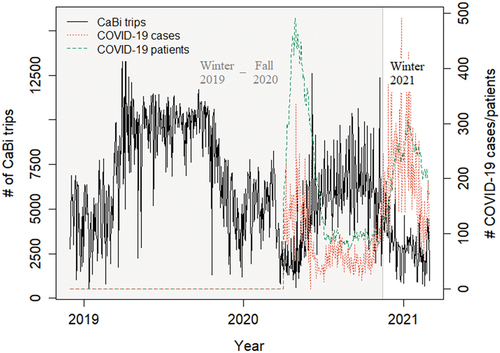
Table 3. Descriptive statistics of the population profile
Table 4. Correlations between CaBi variables and the population profile (demographics, socio-economics, and transportation)
Figure 2. Correlations between COVID-19 cases, CaBi variables and population profile (demographics and socio-economics) in 2020.
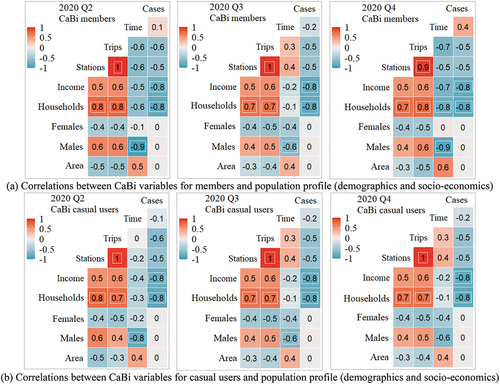
Figure 3. Correlations betweenCOVID-19 cases, CaBi variables and population profile (demographics and transportation) in 2020.
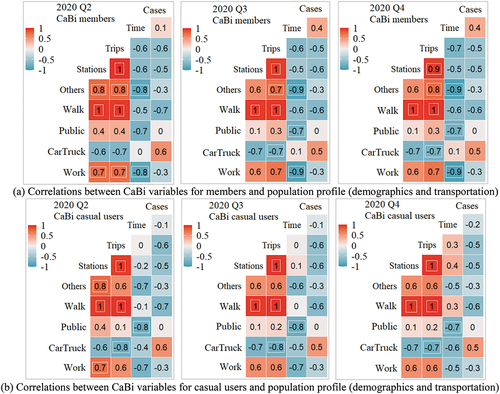
Figure 4. Density map of the 2019-to-2020 change in average daily trip generation.
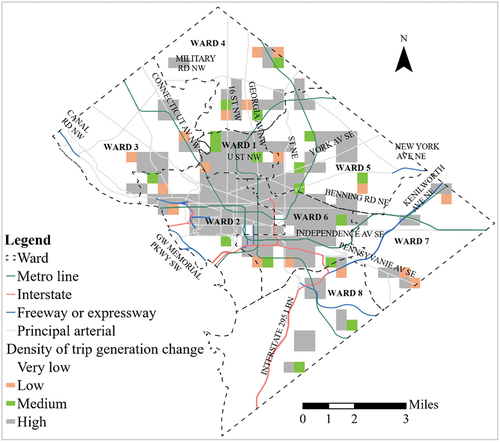
Table 5. MENB Models for ridership of CaBi members
Table 6. MENB models for ridership of CaBi casual users
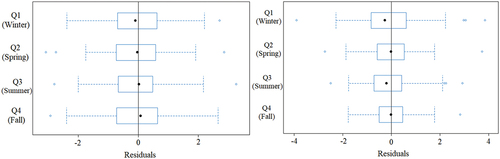
Figure 5. MENB 3 diagnostics on the seasonal effects for CaBi members (left) and casual users (right).