
Figures & data
Table 1. Service quality attributes used for the study.
Table 2. CSI categories.
Figure 1. The IPA map.
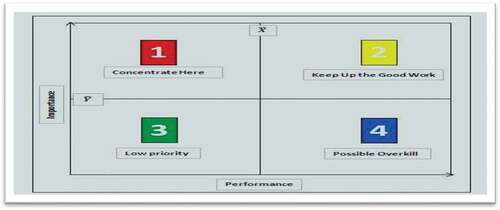
Table 3. The Quadrant’s Interpretation.
Table 4. Reliability statistics.
Figure 2. Socio-demographic profile of the sample.
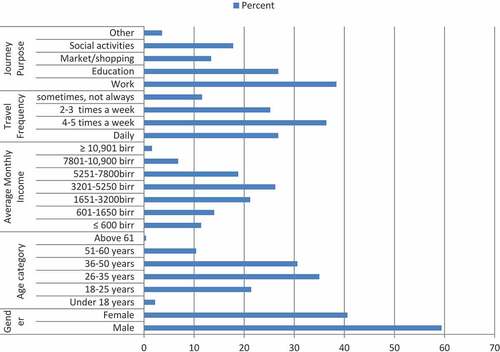
Table 5. Conformity assessment of importance and performance level of attributes.
Table 6. CSI analysis results.
Figure 3. IPA result.
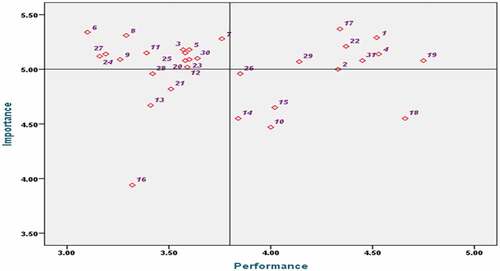
Table 7. Comparison of IPA and CSI results.
Data availability statement
Some or all data, models, and/or codes that support the findings of this study are available from the corresponding author upon reasonable request.