Figures & data
Table 1. Criteria for customer satisfaction index.
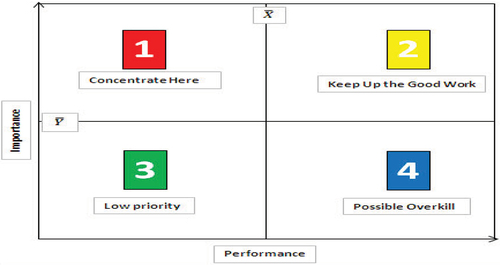
Table 2. Socio-demographic profile of the sample.
Table 3. EFA results for Importance of Service Quality Attributes.
Figure 2. Confirmatory Factor Analysis for Expectation.
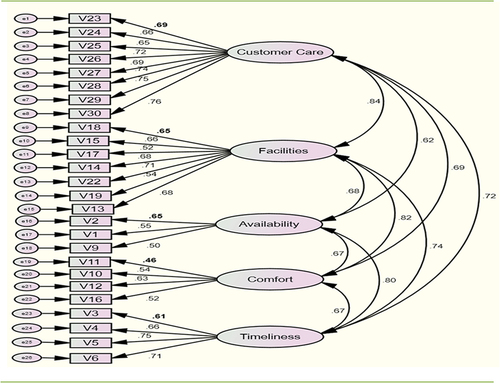
Table 4. The goodness of fit statistics.
Table 5. EFA results for the performance of service quality attributes.
Figure 3. Confirmatory factor analysis for satisfaction.
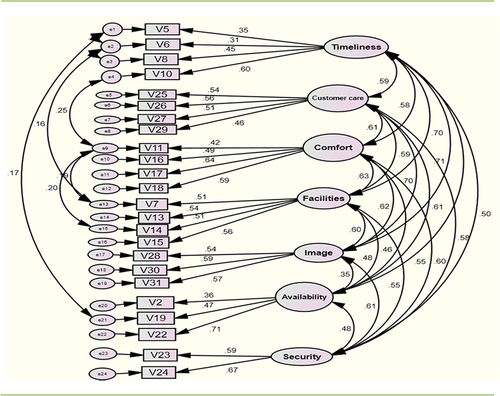
Table 6. The goodness of fit statistics.
Table 7. CSI of the public transport system in the city.
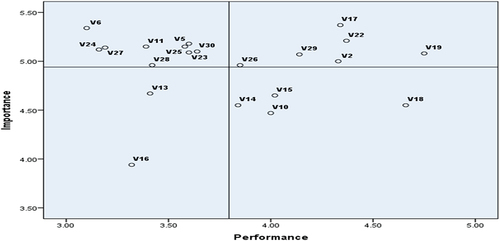
Figure 4. IPA Mapping.