
Figures & data
Figure 1. Total Catchment Area of the GBM River Systems.
Source: Banglapedia, 2006, cited in Uddin and Basak.
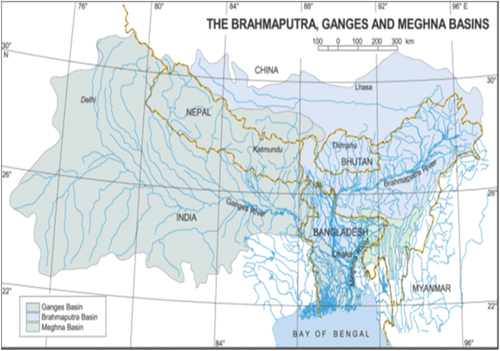
Figure 2. Riverbank-Erosion-Prone Areas in Bangladesh.
Source: Bangladesh Water Development Board.
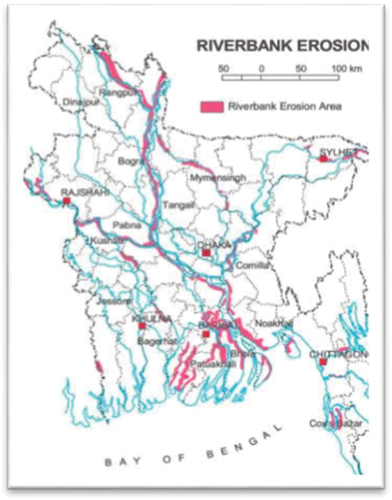
Figure 3. Study Area.
Source: Modified base map of LGED, 2014.
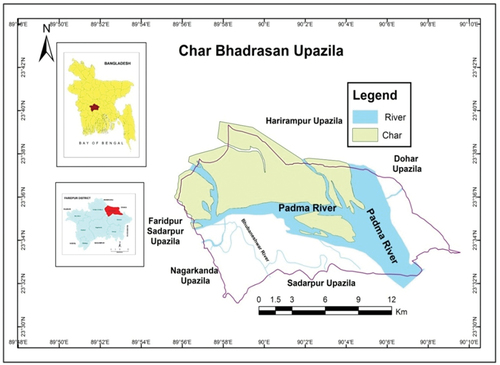
Figure 4. Satellite Images of Study Area since 1972–2014.
Source: USGS Earth Explorer
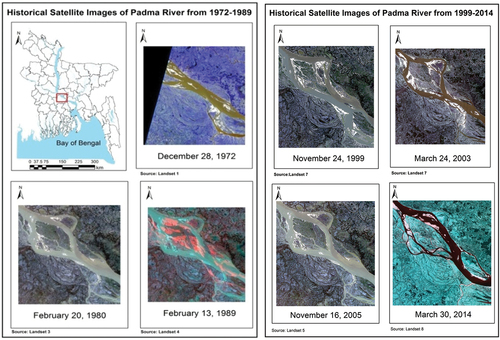
Table 1. Detailed information of the satellite images used in this study.
Table 2. Eroded Village/Mouza in the study area.
Table 3. Land erosion of Charbhadrasan Upazila (2004–13).
Table 4. Erosion vulnerability assessment of Charbhadrasan Upazila (2005–13).
Table 5. Perceived causes of riverbank erosion.
Table 6. Most affected year of land erosion.
Table 7. Monthly average water discharge (m3/sec) at Baruria station.
Figure 5. Preventive Measures of Riverbank Erosion.
Note: Multiple responses considered
Source: Field Survey, December 2013
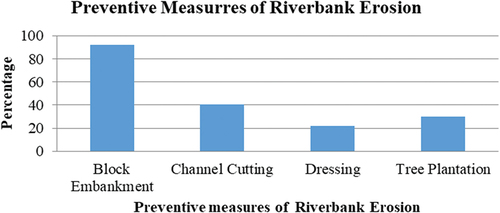
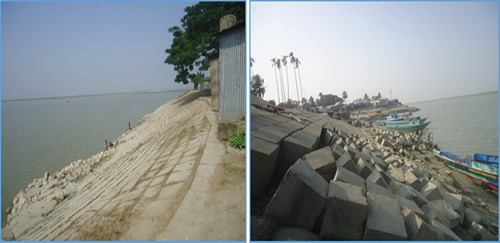
Figure 6. Block Embankment along Bank Line of Padma River in Study Area.
Source: Field Survey, December 2013
Supplemental material