
Figures & data
Figure 1. Map with the locations of the stations in Bern Wankdorf, Ostermundigen, and Bern, including the linear distances between these stations (adapted from OpenStreetMap, Citation2022; CC BY-SA 2.0).
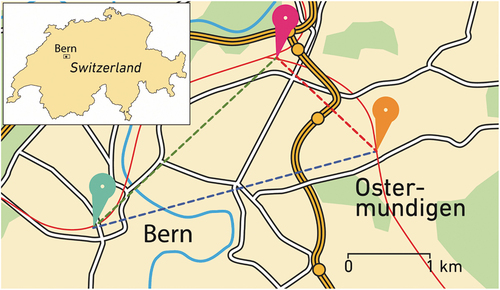
Table 1. Qualitative content analysis: Conceptual operationalization and subcodes from the inductive data analysis (adapted from Brooks et al., Citation2015; Meijer & Van Der Krabben, Citation2018).
Figure 2. Bern Wankdorf station district (own representation; CC BY 4.0).
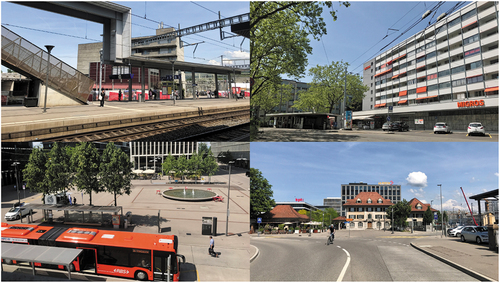
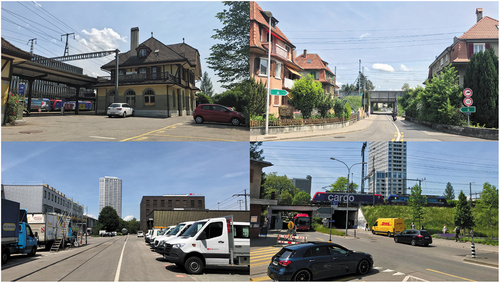
Figure 3. Ostermundigen station district (own representation; CC BY 4.0).
Supplemental material
Supplemental Material
Download PDF (186.9 KB)Data availability statement
Due to the nature of this research, this study’s participants did not agree to allow their data to be shared publicly, so supporting data were not available.