
Figures & data
Table 1. Bus transport performance measures.
Plate 1. Anbessa buses on the road.
Source: Field Observation
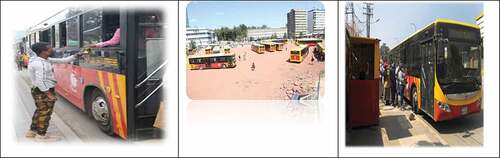
Plate 2. Sheger buses on the road.
Source: Field Observation
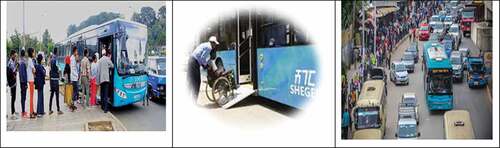
Figure 1. Fleet utilization (%).
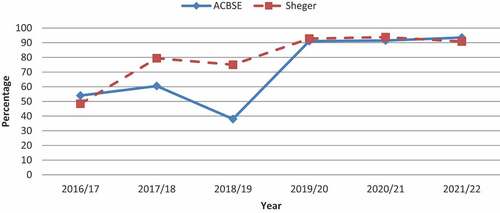
Figure 2. Vehicle productivity: km/bus/day.
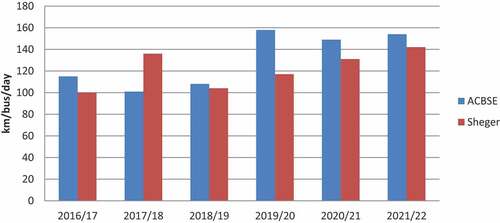
Figure 3. Service utilization (passengers/bus/day).
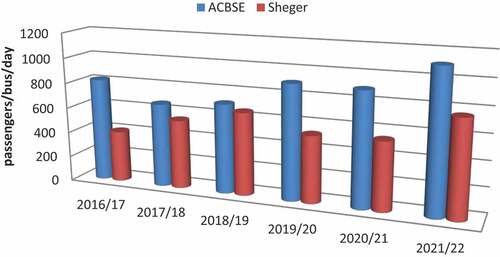
Figure 4. Bus-staff ratio.
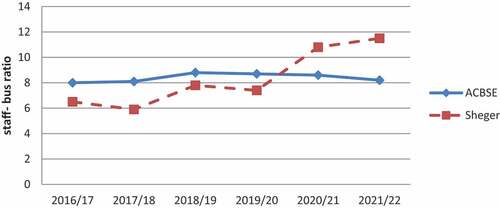
Figure 5. Manpower productivity: km/staff/day.
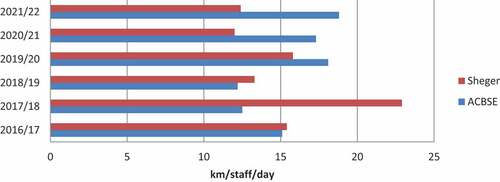
Figure 6. Accidents/100,000kms.
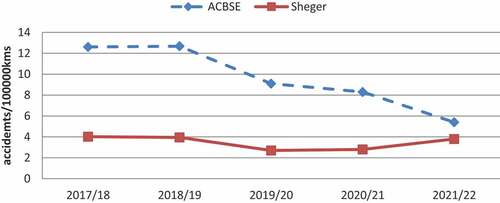
Figure 7. Total revenue/km (in Birr).
*Ethiopian Birr
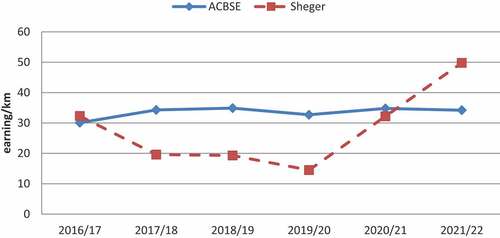
Figure 8. Total cost/km.
*Ethiopian Birr
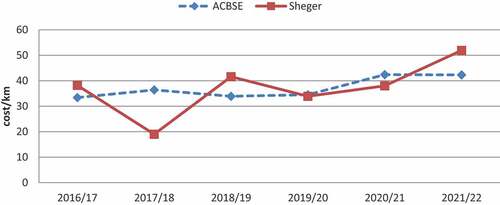
Figure 9. Net profit/loss per km (in birr).
*Ethiopian Birr
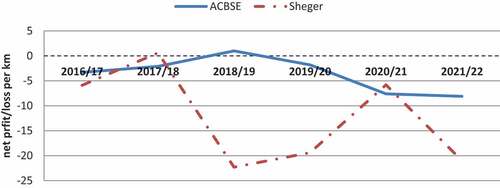
Table 2. Performance comparison with general standards.
Table 3. Summaries of key results.
Data availability statement
Some or all data, models, and/or codes that support the findings of this study are available from the corresponding author upon reasonable request