Figures & data
Figure 1. Flowchart of tiny house characteristics in Indonesia based on millennial’s user preference.
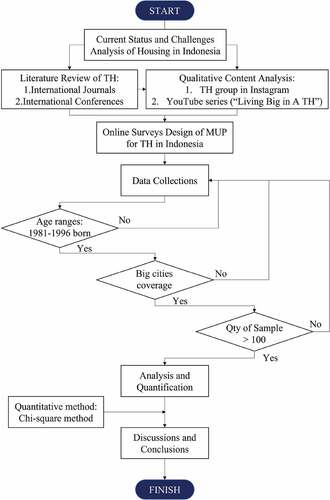
Figure 2. Population density of selected provinces (a) in 2021, and (b) in period from 2013 to 2021.
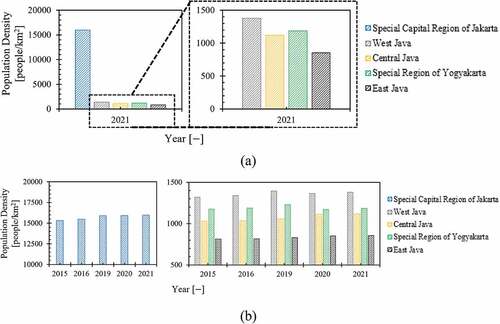
Figure 3. Normalized population density of selected provinces in period from 2013 to 2021.
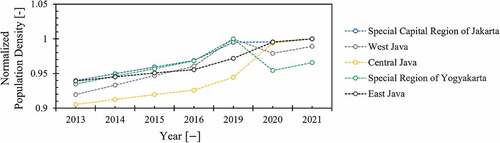
Figure 4. Family population of selected provinces in period from 2013 to 2016.
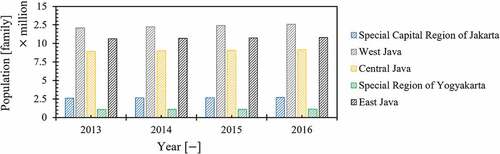
Figure 5. Averaged proportion of housing status of selected province.
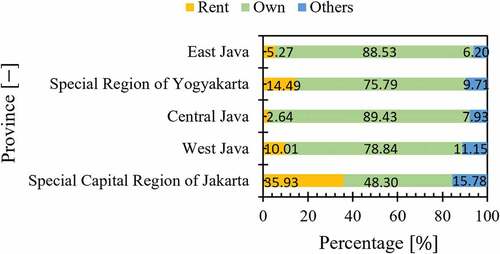
Figure 6. Dependency ratio of selected province in projection period from 2015 to 2035.
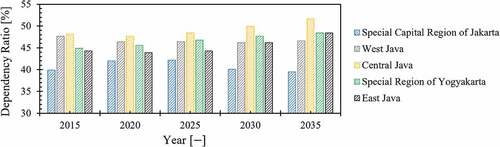
Figure 7. (a) Opening page of online surveys delivered in Bahasa Indonesia, (b) Example of housing designs by @duastudio architecture and design studio (duastudio, Citation2018) for online surveys.
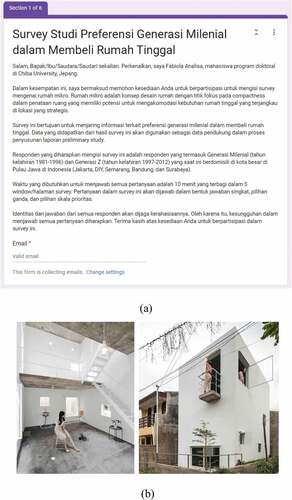
Table 1. URL link of online surveys in June and December 2021.
Table 2. Chi-square critical value for for r = 1–10.
Figure 8. Distribution of respondents’ age.
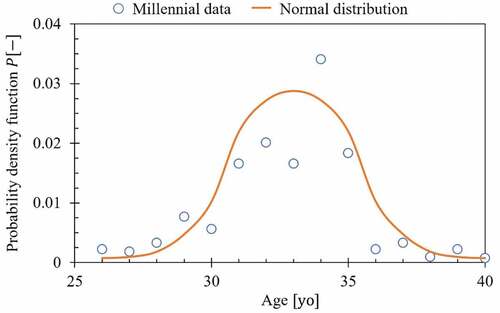
Figure 9. Type of House based on MUP.
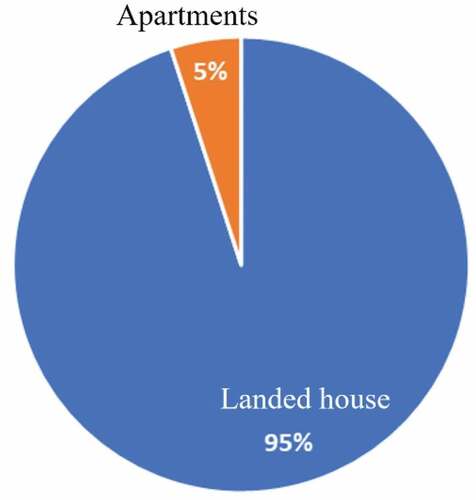
Figure 10. Monthly Income of Respondents.
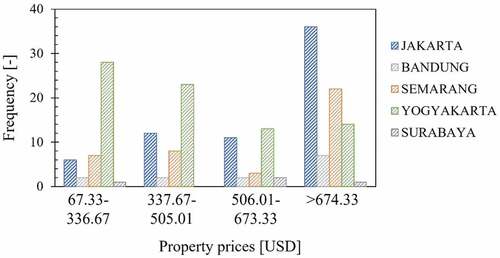
Figure 11. (a) Distribution and (b) Trendline of property prices based on millennials income.
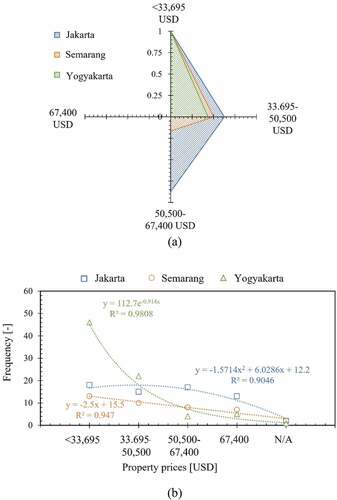
Figure 12. Comparison of property mean price and preferred prices based on millennials income.
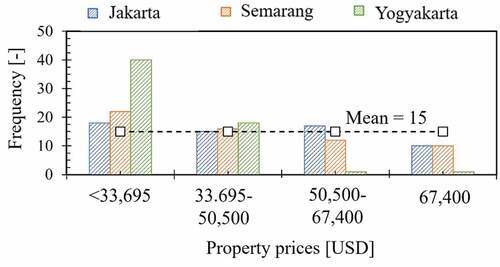
Figure 13. (a) Distribution and (b) Trendline of property sizes based on millennials income.
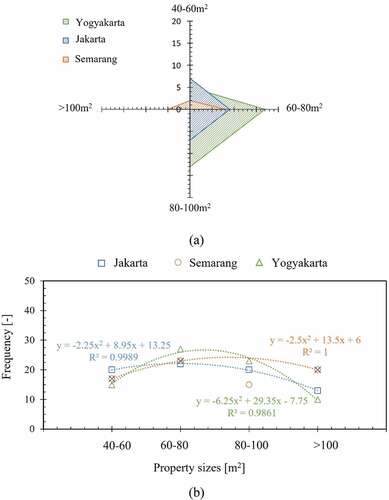
Figure 14. Realistic property size based on millennials income.
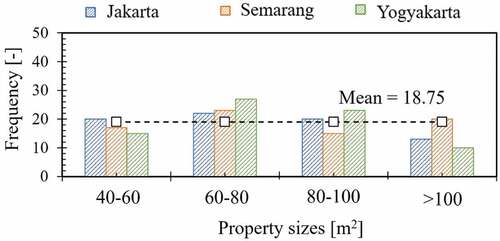
Figure 15. (a) Distribution and (b) Trendline of expected property sizes based on millennials user preferences.
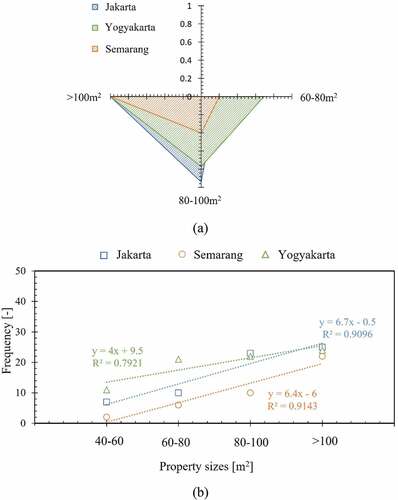
Figure 16. Expected property size based on millennials user preferences.
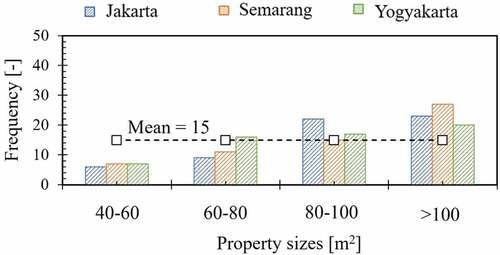
Table 3. Results of Chi-square analysis of property price based on millennials user preference.
Figure 17. Property price based on millennials user preference for different variance of null hypotheses.
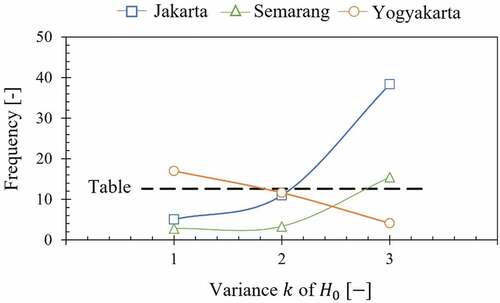
Figure 18. Property size based on millennials user preference for different variance of null hypotheses.
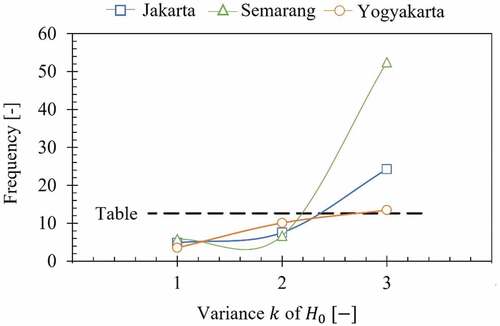
Table 4. Results of Chi-square analysis of property size based on millennials user preference.
Figure 19. Conventional house floor plan.
Figure 20. Tiny house (TH) floor plan based on MUP.