
Figures & data
Figure 1. Public transportation network of Addis Ababa city mainly city-buses and minibus taxis.
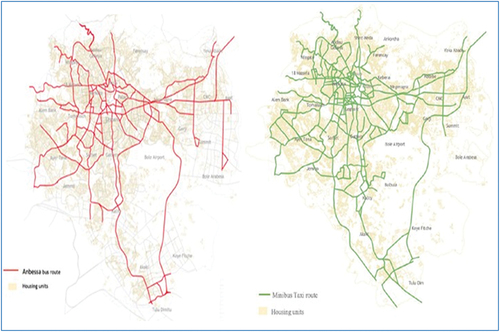
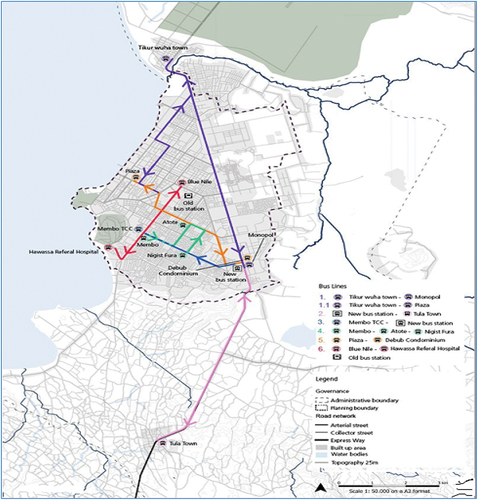
Table 1. Operationalization of variables used to analyze the factors of mode choice.
Figure 3. Conceptual Framework: Causal Links between COVID-19 pandemic, PT Mode Choices and Travel Risks as Mediating Variables.
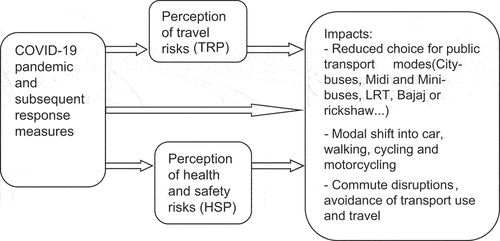
Table 2. Perception of pandemic severity, travel risk vulnerability and protective measures.
Table 3. Mode choices of Passengers for daily trips before and during the pandemic.
Table 4. Factors determining PT mode choice before and during COVID-19 pandemic.
Figure 4. Overall percentage share of public transport mode choice in both cities before and during the pandemic.
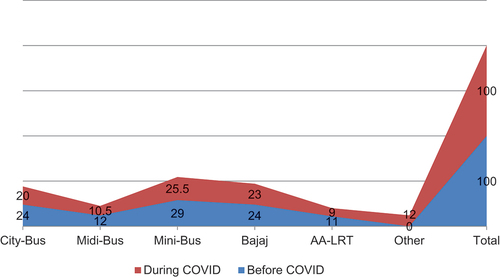
Figure 5. Total public transport choice frequency per week before and after COVID-19 in both cities.
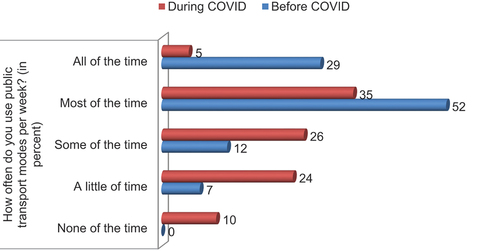
Table 5. Mode choice modeling during the COVID-19 period.
Table 6. Probability of modal shift (from PT) in the future post-COVID (in 18–24 months).
Table 7. The anticipated modal choice in the future or post-COVID (in 18–24 months).
Table 8. Justifications for the anticipated less use of and shift from public transport in the future.