Figures & data
Table 1. Research methods used to address visual perception or urban elements.
Figure 1. Flow diagram of the methodology.
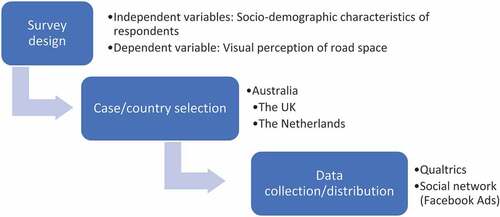
Table 2. Survey design outline.
Figure 2. Example of the question presented in the online survey. (Image source: Google Maps).
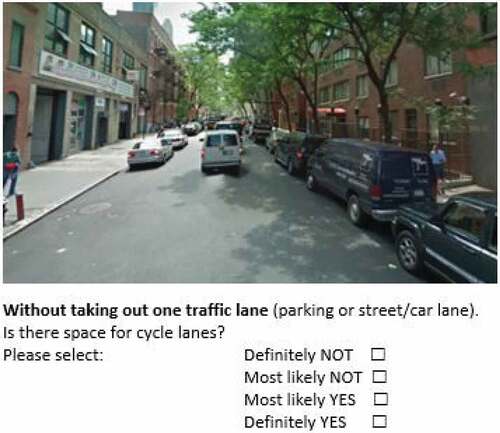
Figure 3. Age distribution by country.
Table 3. Sample description (source: Loyola et al. (Citation2022)).
Figure 4. Diagram flow for the analysis of the visual perception of road space (sub-sections in brackets).
Figure 5. Average recognition of having space for cycle lanes.
Table 4. Univariate logistic regression of visual perception of road space.
Table 5. Results: binary logistic regression.
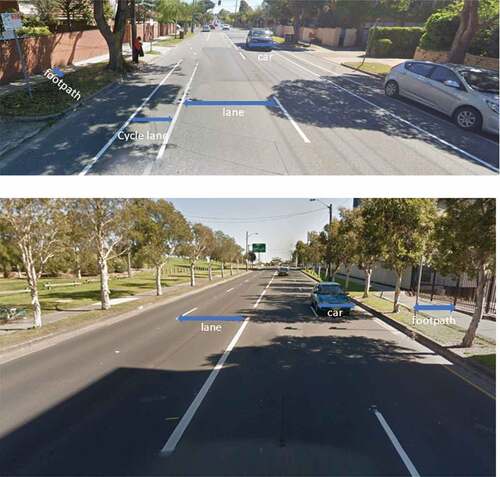
Table 6. Average measures (metres) of road elements from the presented images.
Figure A1. Images of the streets presented to the respondents.
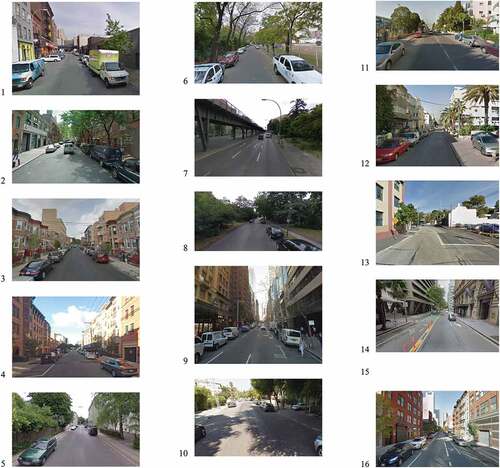
Figure A2. Images 1 and 2 (descending order) presented to respondents to estimate other road elements (section 4.3).