Figures & data
Table 1. Data Summary for North Lanarkshire Council and Huq 2020 and 2019 (baseline).
Figure 1. Total reports to North Lanarkshire Council 2019-01-01 to 2019-07-01 and 2020-01-01 to 2020-07-01.
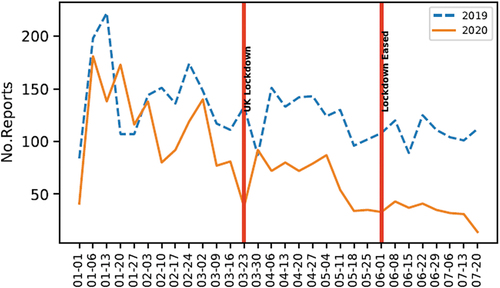
Figure 2. Total reports to North Lanarkshire Council in the most deprived quintile of neighbourhood (Q1) and least-deprived quintile of neighbourhoods (Q5), 2019-01-01 to 2019-07-01 and 2020-01-01 to 2020-07-01.
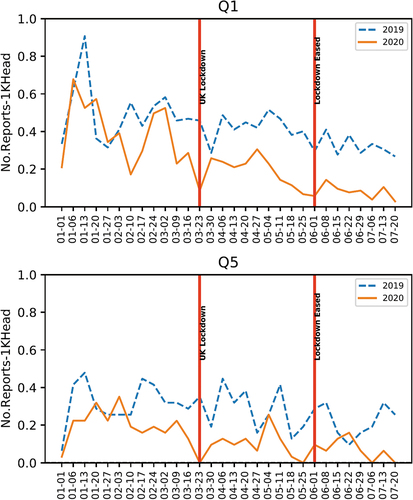
Figure 3. Proportions of different types of reports to North Lanarkshire Council 2019-01-01 to 2019-07-01 and 2020-01-01 to 2020-07-01.
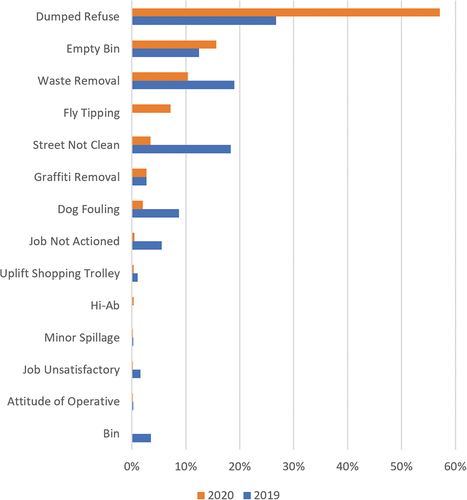
Figure 4a. Median distance between home address and report location in neighbourhood deprivation quintiles (Q1 most deprived; Q5 least deprived) to North Lanarkshire Council 2019-01-01 to 2019-07-01 and 2020-01-01 to 2020-07-01.
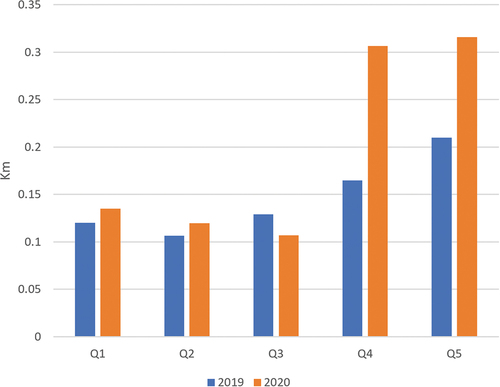
Figure 4b. Median distance between home address and report location in neighbourhood deprivation quintiles (Q1 most deprived; Q5 least deprived) by women to North Lanarkshire Council 2019-01-01 to 2019-07-01 and 2020-01-01 to 2020-07-01.
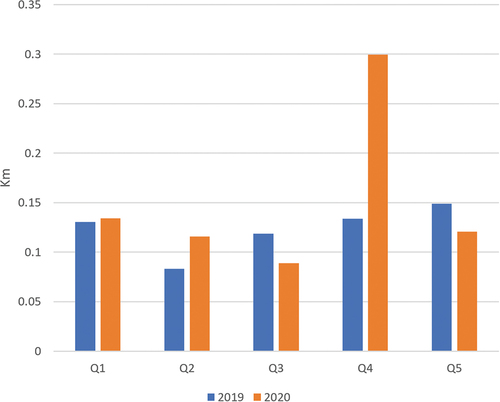
Figure 4c. Median distance between home address and report location in neighbourhood deprivation quintiles (Q1 most deprived; Q5 least deprived) by men to North Lanarkshire Council 2019-01-01 to 2019-07-01 and 2020-01-01 to 2020-07-01.
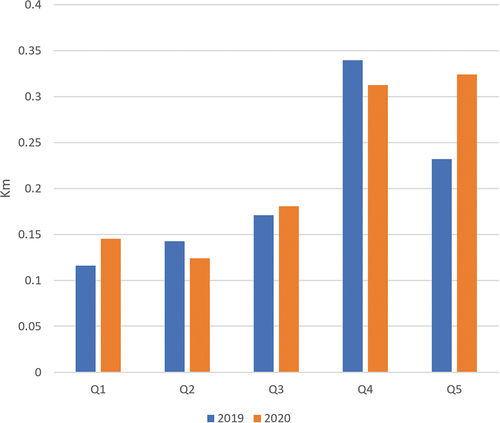
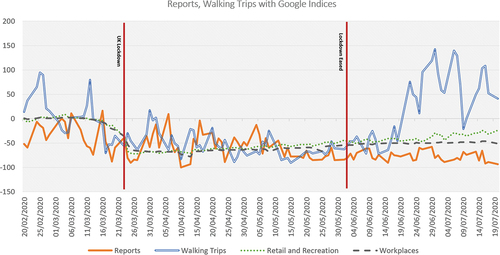
Figure 5. Percentage change in reports to North Lanarkshire Council compared to walking trips detected in Huq data, 2020-02-20 to 2020-07-19.
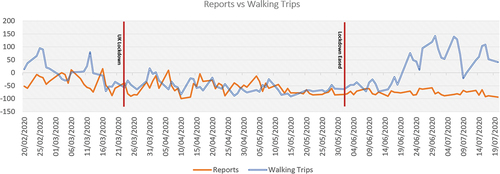
Figure 6. Percentage change in reports to North Lanarkshire Council compared to walking trips detected in Huq data and destination of Huq trips as identified through Google Mobility Indices, 2020-02-20 to 2020-07-19.