
Figures & data
Figure 1. Major transport networks in MMR, 2022.
Source: Prepared by the authors based on ArcGIS base map and MMRDA (Citation2016).
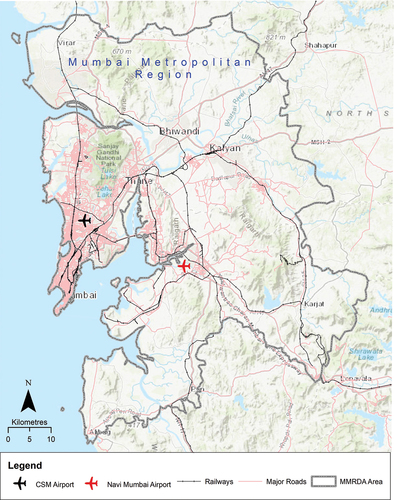
Figure 2. Major transport infrastructure under construction in MMR, 2019.
Source: Created by authors based on ArcGIS base map & MMRDA (Citation2016).
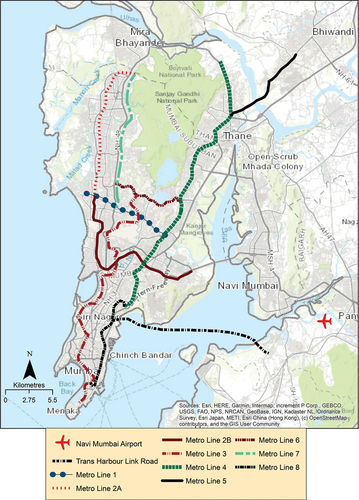
Figure 3. Annual growth rate (%) of vehicles in MMR and its major sub-regions vis-a-vis Maharashtra state, 2001–2019.
Source: Computed using data from the Government of Maharashtra (Citation2017, Citation2020).
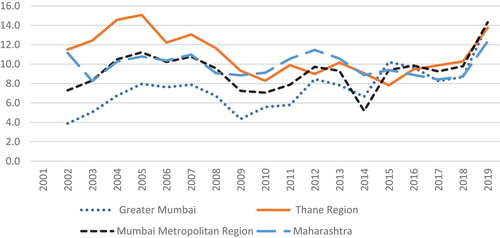
Table 1. Vehicular population in MMR, 2001–2019.
Table 2. Types of registered vehicles by regions in MMR.
Table 3. Share of respondents using different modes of travel, average distance, time of travel and expenses in MMR.
Table 4. Reasons for time loss in waiting.
Table 5. Multinomial regression representing determinants of modal selection.
Table 6. Share of respondents with the major problem of mobility faced.
Table 7. Major transport development plans for Mumbai Metropolitan Regions (MMR).