
Figures & data
Table 1. Quantitative assessment of influence zones for railway stations.
Figure 1. Sample size determination for Passenger OD surveys.
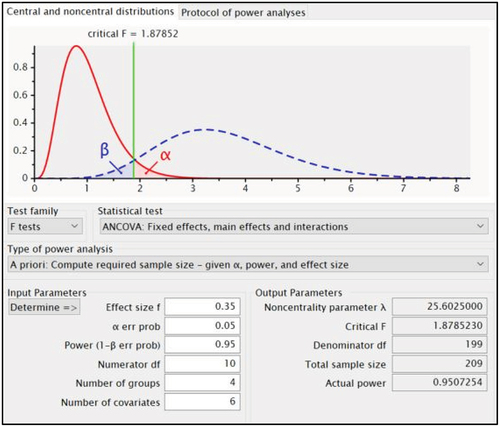
Figure 2. Comparison of passenger characteristics for Category 4 and Category 1 Stations.
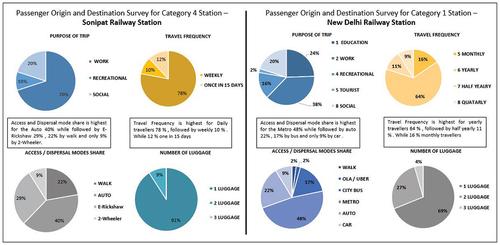
Figure 3. Trip Length Frequency distribution for selected Category 4 Stations.
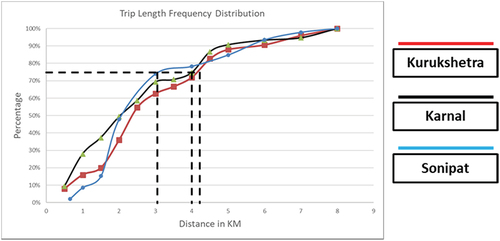
Table 2. Influence zones based on primary study.
Figure 4. Trip Length Frequency distribution for selected 2 and 3 Stations.
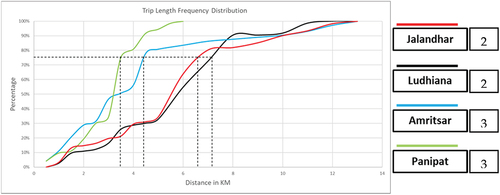
Figure 5. Trip Length Frequency distribution for selected Category 2 station - Ambala.
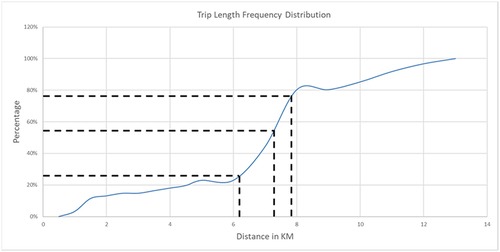
Table 3. Observed Influence zone for Category 3 Stations.
Table 4. Observed Influence Zone for Category 2 Stations.
Figure 6. Trip Length Frequency distribution for selected Category 1 station – New Delhi.
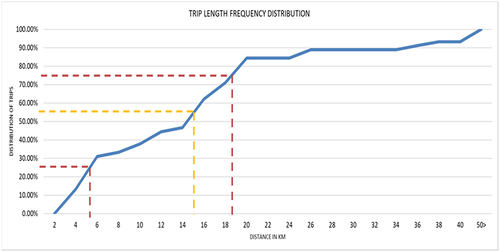
Figure 7. Sample size determination for Station selection.
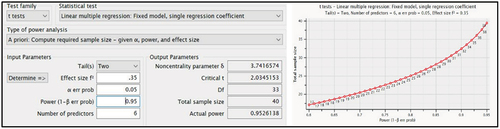
Table 5. Influence zone assessment for different Hierarchy of stations.
Table 7. Pearson Correlation among Railway station Category, Importance of the station and Contour catchment.
Table 6. Summary Statistics for the selected stations.
Table 8. Summary Table for contour catchment.
Table 9. Category-wise Contour Catchments (K-Mean Clustering).
Table 10. Anova Test for k-Mean Clustering.
Figure 8. Railway Station Importance vs Contour Catchment for Indian Railway Stations.
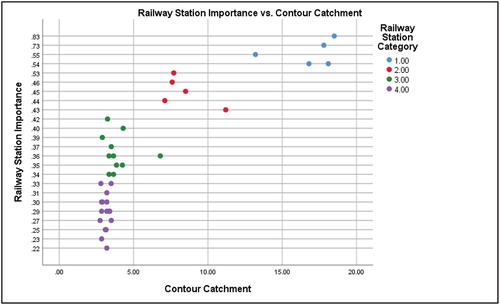
Table 11. Summary table of regression analysis.
Figure 9. Importance of the station vs Contour catchment.
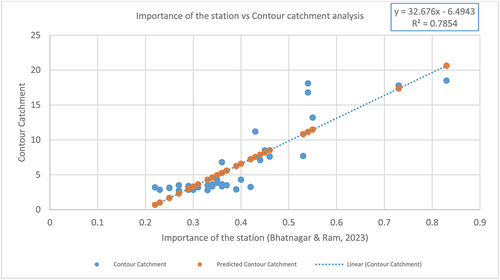
Figure 10. Box-plot for Contour catchment and Railway Station Importance.
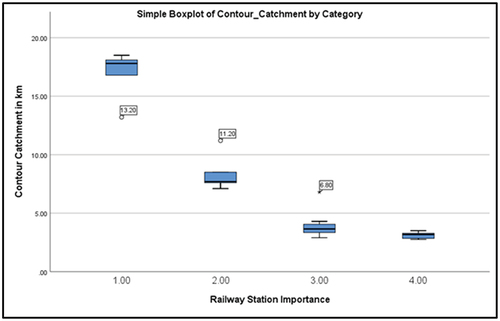
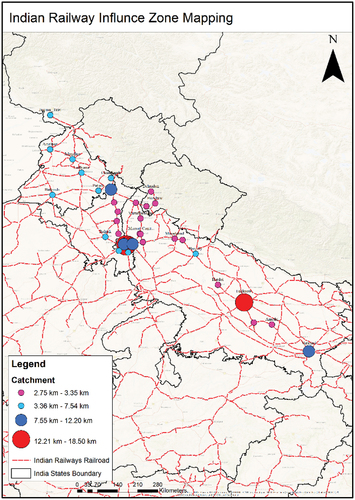
Figure 11. Indian Railways Influence zone mapping.
Data availability statement
Due to the nature of the research, supporting data is not available.