
Figures & data
Figure 1. Study framework.
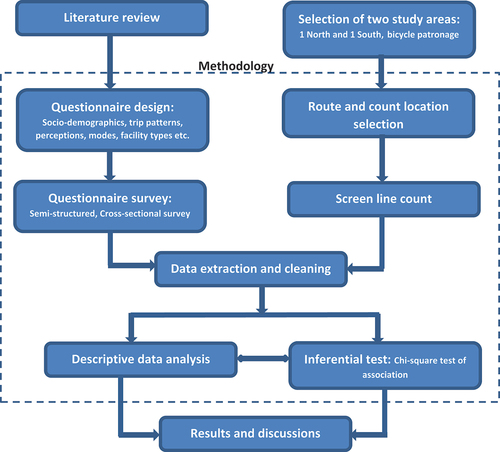
Figure 2. A map showing respondents’ locations and traffic census points within the AEMA study area (source: created by the authors from QGIS 3.28.1).
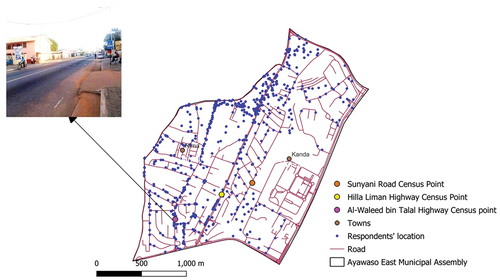
Figure 3. A map showing respondents’ locations and traffic census points within the TaMA study area (source: created by the authors from QGIS 3.28.1).
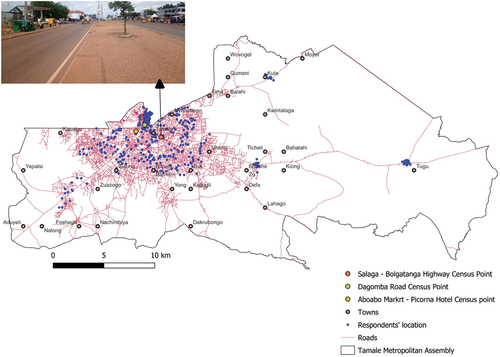
Table 1. Active transport users’ and non-users’ characteristics.
Figure 4. Infrastructure or route choices by active transport users (peds and cyclists) in (a) AEMA and (b) TaMA.
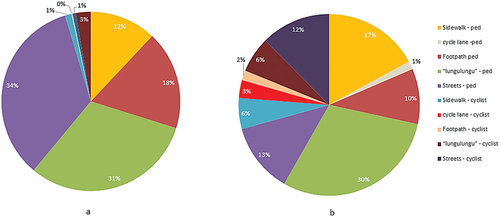
Figure 5. Infrastructure or route types and demography of users in AEMA.
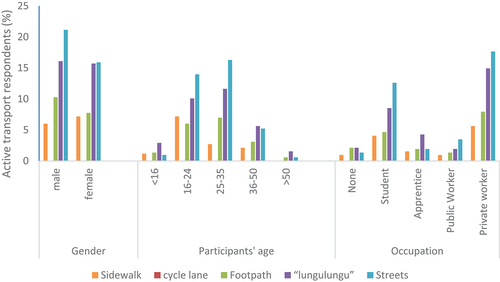
Figure 6. Infrastructure or route types and demography of users in TaMA.
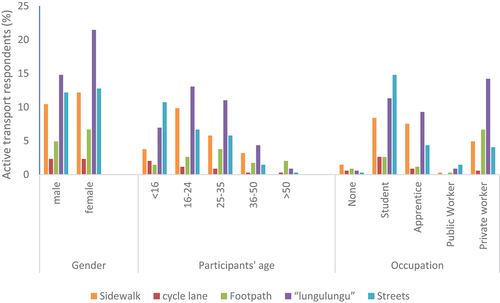
Table 2. Motivation for infrastructure choice by cyclists and pedestrians in Ayawaso East Municipal Assembly and Tamle Metropolitan Assembly.
Figure 7. Motivation and demographics of respondents’ choice of infrastructure or routes in AEMA.
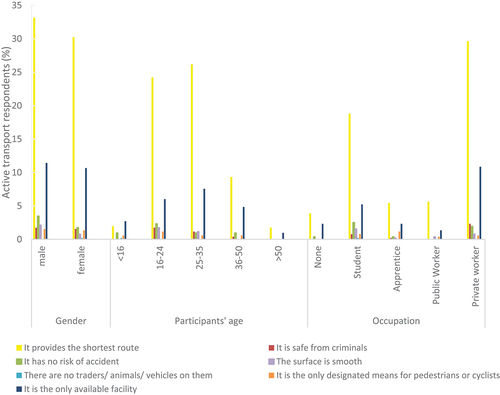
Figure 8. Motivation and demographics of respondents’ choice of infrastructure or routes in TaMA.
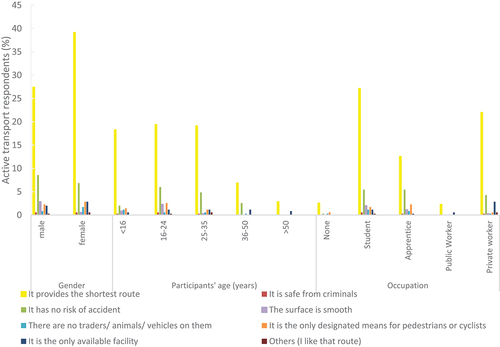
Table 3. Twelve-hour volume count of pedestrians and cyclists on either streets or dedicated infrastructures in AEMA and TaMA.