Figures & data
Figure 1. Public transit modes in Addis Ababa, Ethiopia.
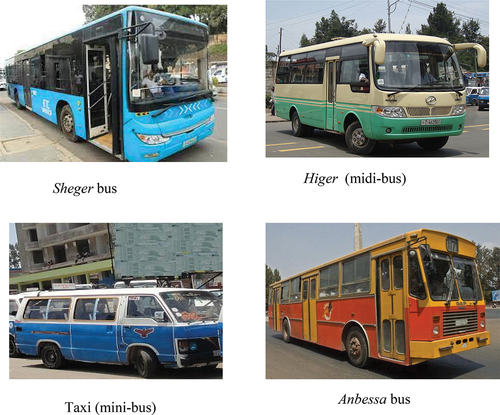
Table 1. Public transit routes and coverage.
Figure 2. Major transit stations in Addis Ababa (study stations) (Authors 2022).
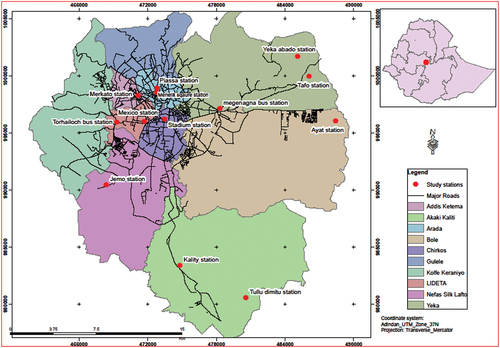
Table 2. Socio-demographic profile of respondents.
Figure 3. Modal usage.
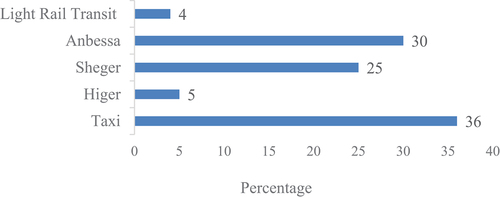
Table 3. Cross tabulation of mode choice by personal and trip attributes.
Figure 4. Trip purposes (on weekday and weekend).
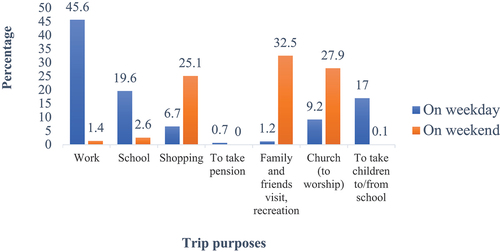
Table 4. Mode preference and trip purposes.
Table 5. Reasons for choosing a particular mode of transport.
Table 6. Results of multinomial logistic regression.
Figure 5. Desired improvement requirements on public transport service.