Figures & data
Figure 1. Location map of Ma’anshan City.
Figure 2. Evaluation index system for assessing the suitability of underground space.
Figure 3. Kernel density of points of interest (POI).
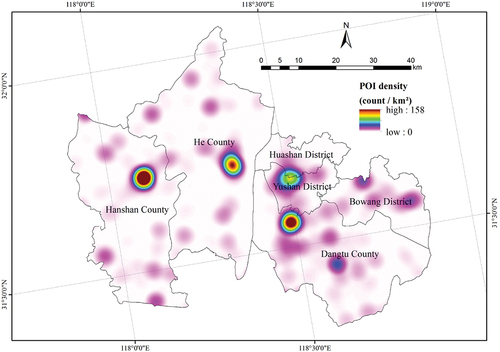
Figure 4. Distribution of road node connection rate.
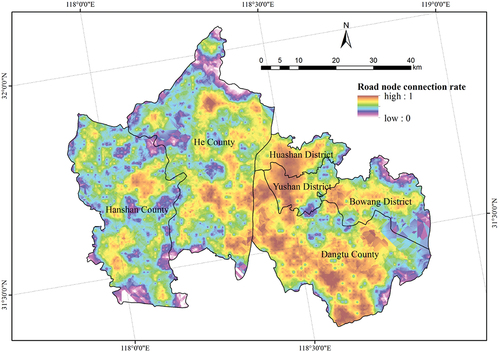
Figure 5. Nighttime light radiance in Ma’anshan, 2021.
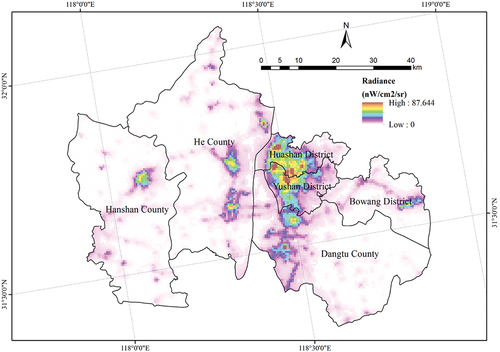
Figure 6. Magnitude of change in night light radiance from 2013 to 2021.
(95% confidence interval)
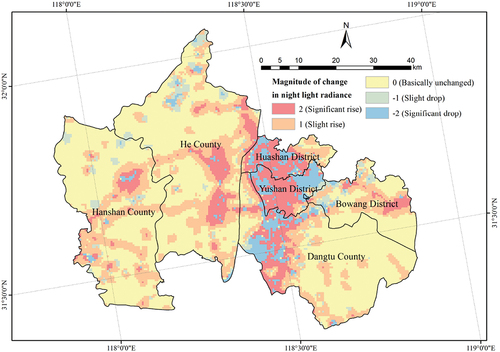
Figure 7. Population density in 2020.
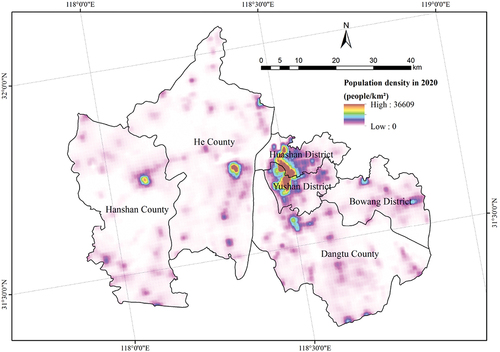
Figure 8. Amplitude of change in population density from 2013 to 2020 (95% confidence).
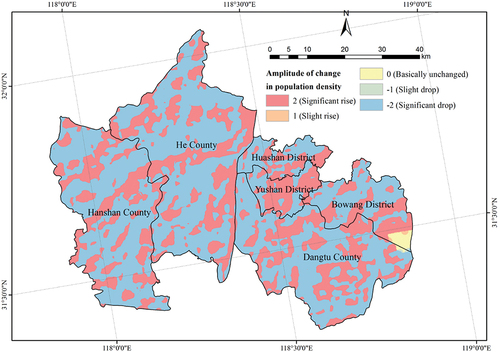
Table 1. Weight of indices for evaluating the suitability of underground space development.
Figure 9. Suitability levels for underground space development.
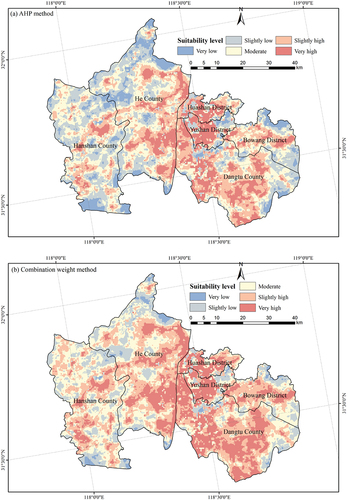
Table 2. Proportions of suitability levels for underground space development in each district.
Figure 10. Local cluster analysis of the suitability index.
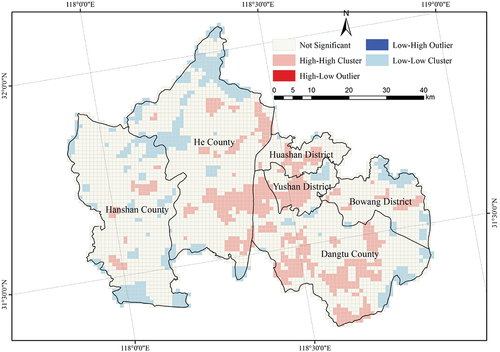
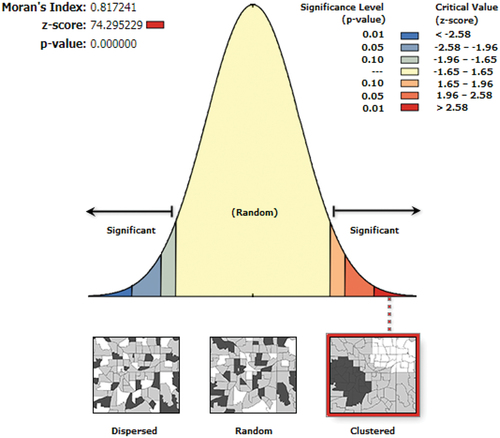
Figure 11. Global cluster analysis based on the suitability index.