
Figures & data
Figure 1. Vehicle proportions in Bandung City.
Note: (Bandung City Central Bureau of Statistics, Citation2018)
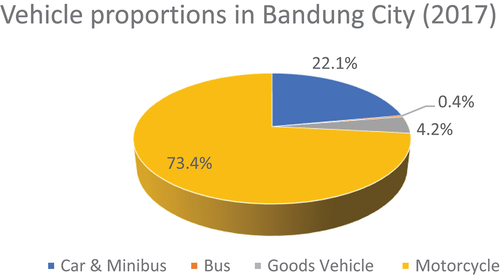
Table 1. Longlisted attributes for the initial survey.
Table 2. Attribute levels for the stated preference survey.
Table 3. Respondent Socio-Economic characteristics (left) and travel characteristics (right) (N = 663).
Figure 2. Respondent travel purpose.
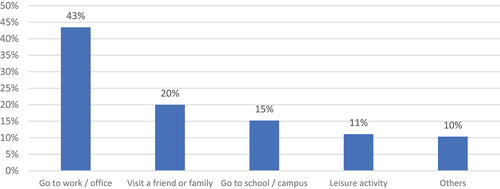
Figure 3. Respondent travel distance.
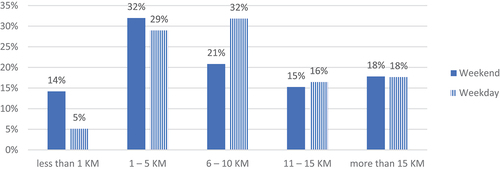
Figure 4. E-motorcycle incentives preferred by the respondents.
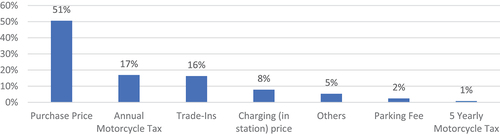
Table 4. Scaling and distributional assumptions.
Table 5. Model results.
Table 6. Likelihood ratio test.
Figure 5. Willingness-to-pay distributions.
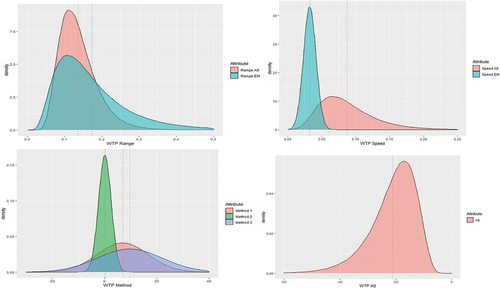
Table 7. Willingness-to-pay distributions (in millions of IDR).