
Figures & data
Figure 1. Most and least deprived areas in London.
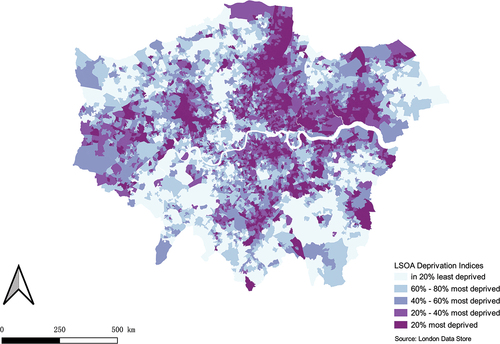
Figure 2. Number of most and least deprived areas in London boroughs (Elvery, Citation2019).
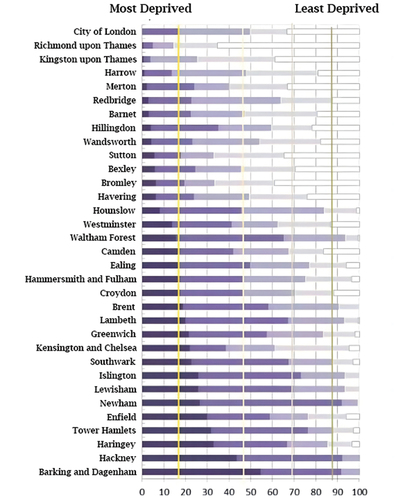
Figure 3. Opportunity areas allocation in London (Drozdz, Citation2020).
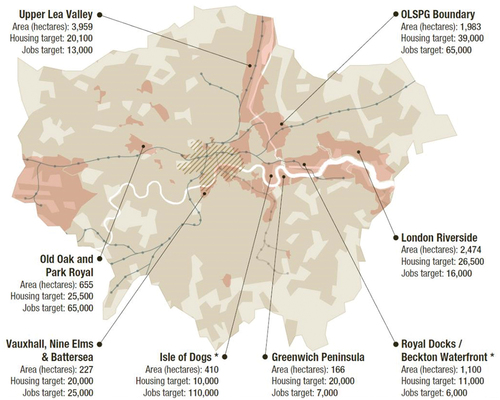
Figure 4. Structure of the research methods.
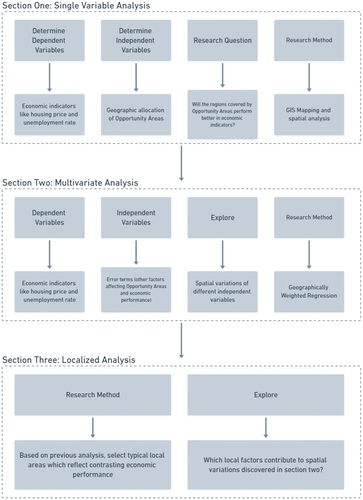
Figure 5. Spatial analytics process of Section One.
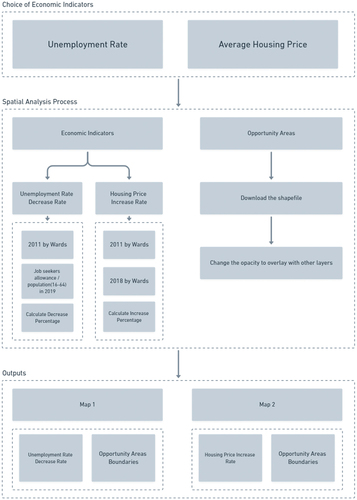
Figure 6. Increase in real housing price from 2011 to 2018.
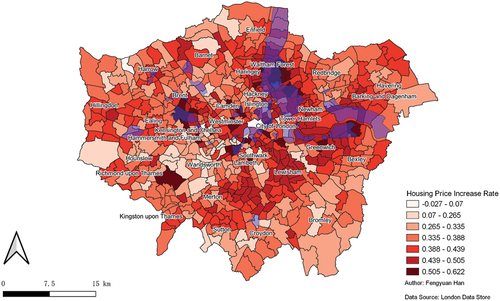
Figure 7. Rate of decrease in unemployment rate from 2011 to 2019.
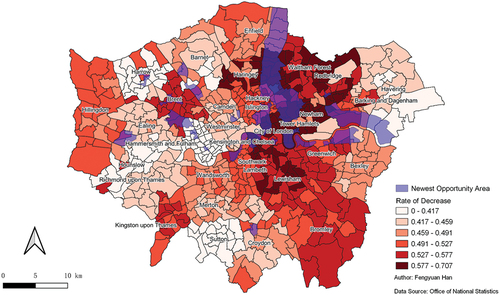
Figure 8. Spatial analytics process of the Section Two.
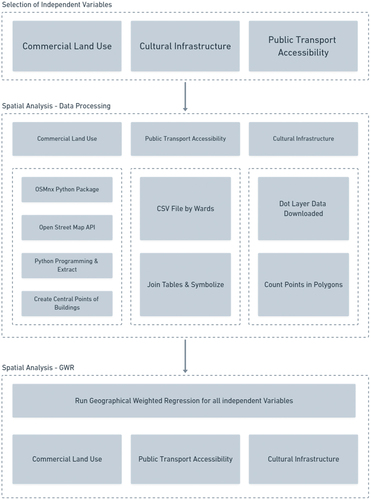
Figure 9. Commercial land use coefficient of housing price increase rate.
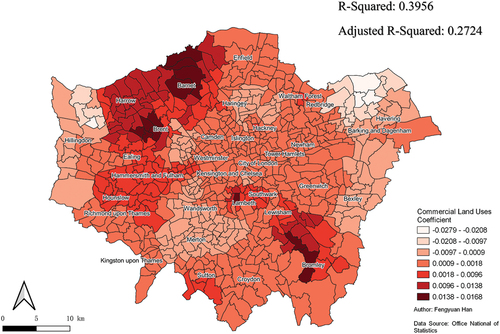
Figure 10. Cultural infrastructure coefficient of housing price increase Rate.
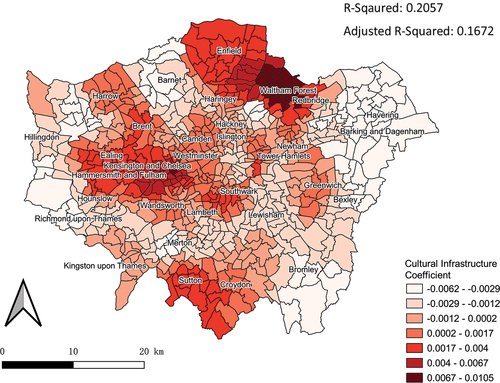
Figure 11. Public transport accessibility coefficient of housing.
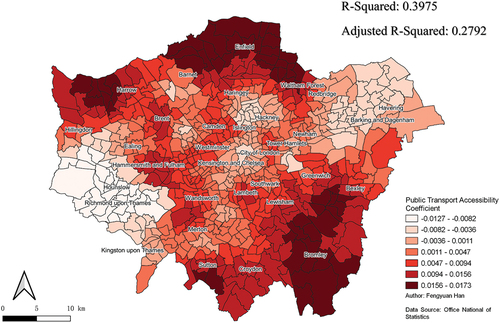
Figure 12. Commercial land use coefficient of unemployment decrease rate.
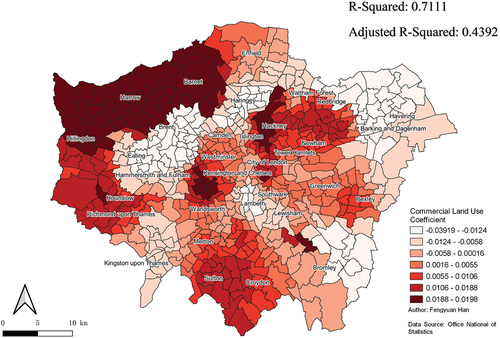
Figure 13. Cultural infrastructures’ coefficients of decrease in unemployment Rate.
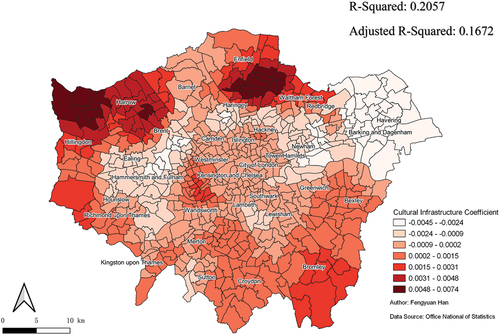
Figure 14. Public transport accessibility levels’ coefficient of decrease in unemployment rate.
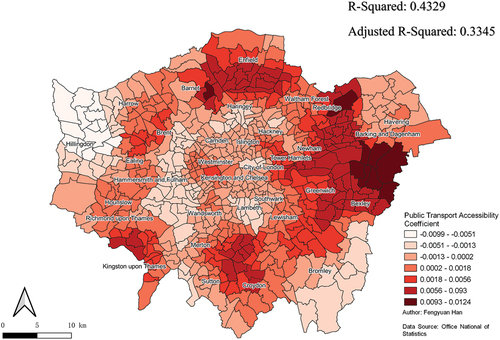
Figure 15. Selected Wards areas for localized Analysis.
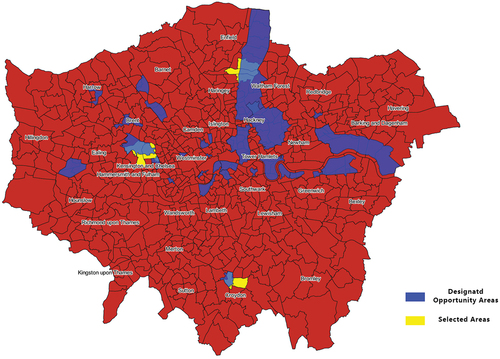
Table 1. Summary of statistics for selected Areas*a.
Figure 16. Open Street map of localized Lee Valley Opportunity Area.
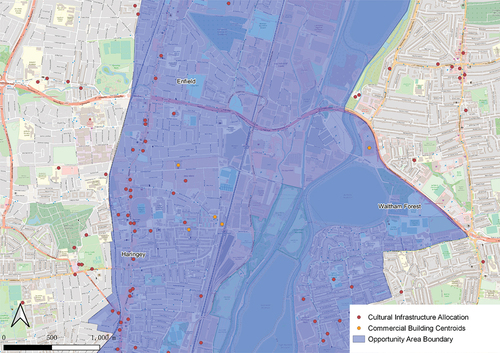
Figure 17. Open Street map of localized Park Royal Opportunity Area.
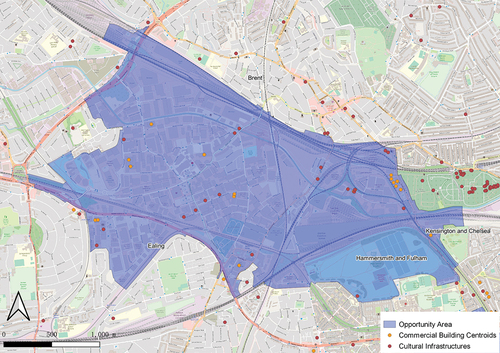
Figure 18. Local land uses map (Greater London Authority, Citation2011b).
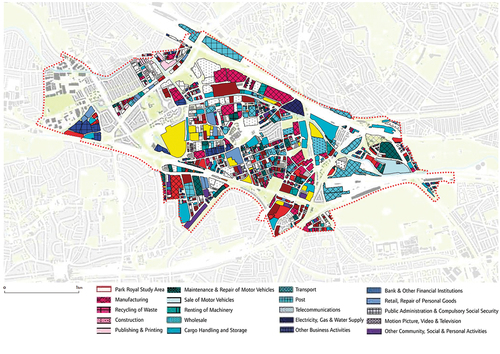
Figure 19. Open Street map of localized Croydon Opportunity Area.
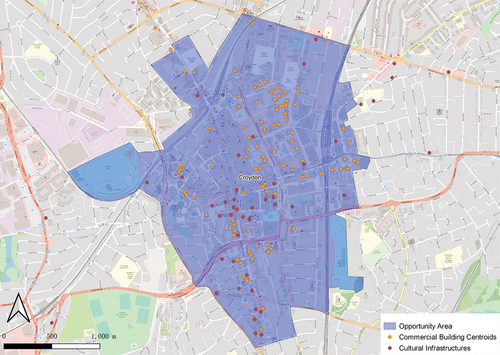
Figure 20. Local land use percentages (Greater London Authority, Citation2013).
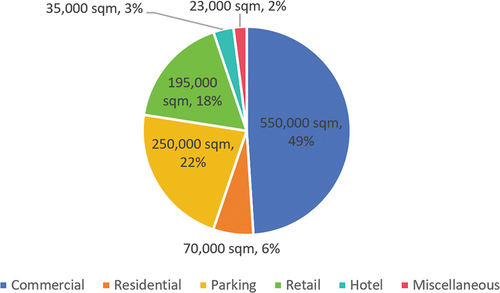
Figure A1. Distribution of housing price increase Rate.
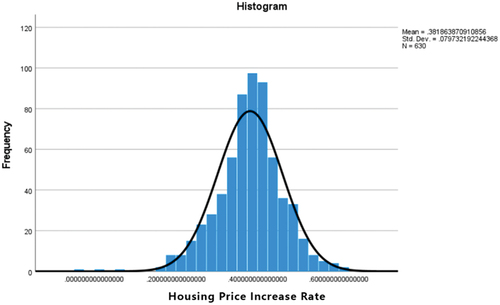
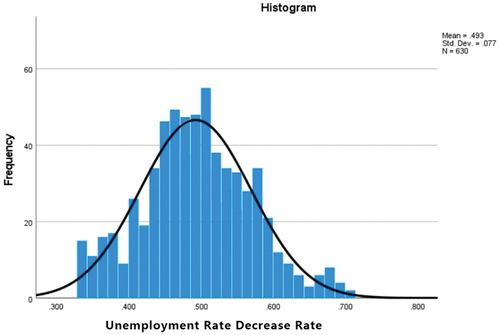
Figure A2. Distribution of unemployment decrease rate.
Data availability statement
All the datasets used in this research paper can be obtained through some open access portals:
Data Store, L., 2022. Opportunity Areas – London Datastore. [online] Data.london.gov.uk. Available at: <https://data.london.gov.uk/dataset/opportunity_areas> [Accessed 17 July 2022].
London Data Store., 2019. Average House Prices by Borough, Ward, MSOA & LSOA – London Datastore. [online] Data.london.gov.uk. Available at: <https://data.london.gov.uk/dataset/average-house-prices> [Accessed 17 July 2022].
London Data Store, 2019. Cultural Infrastructure Map – London Datastore. [online] Data.london.gov.uk. Available at: <https://data.london.gov.uk/dataset/cultural-infrastructure-map> [Accessed 17 July 2022].
London Data Store., 2011. Ward Profiles and Atlas – London Datastore. [online] Data.london.gov.uk. Available at: <https://data.london.gov.uk/dataset/ward-profiles-and-atlas> [Accessed 17 July 2022].
London Data Store., 2015. Public Transport Accessibility Levels – London Datastore. [online] Data.london.gov.uk. Available at: <https://data.london.gov.uk/dataset/public-transport-accessibility-levels> [Accessed 16 July 2022].
London Data Store., 2019. Indices of Deprivation – London Datastore. [online] Data.london.gov.uk. Available at: < https://data.london.gov.uk/dataset/indices-of-deprivation> [Accessed 1 September 2023].
Nomis – Official Census and Labour Market Statistics. 2019. [online] Available at: <https://www.nomisweb.co.uk/> [Accessed 17 July 2022].
Dataset of POIs’ DOI is referenced as below: