
Figures & data
Figure 1. Map of the study route.
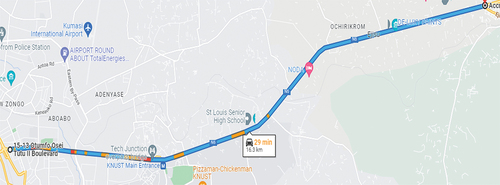
Table 1. Summary of roadway features for the section of the study route.
Table 2. The percentage share of paratransit travel time components on the study route.
Figure 2. Travel time observation within the day in different one-hour departure windows with 10th, 50th, and 90th percentiles: (a) Adum to Ejisu (b) Ejisu to Adum.
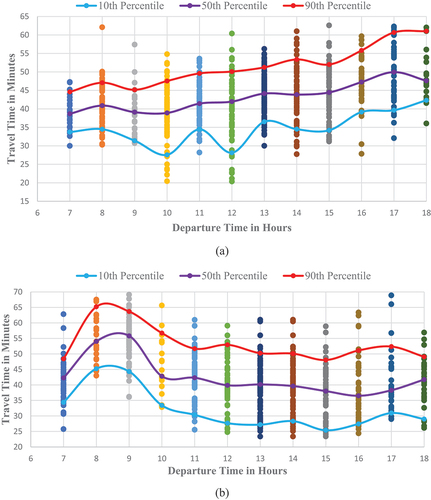
Figure 3. Differences in travel time percentiles across the day in different one-hour departure windows: (a) Adum to Ejisu (b) Ejisu to Adum.
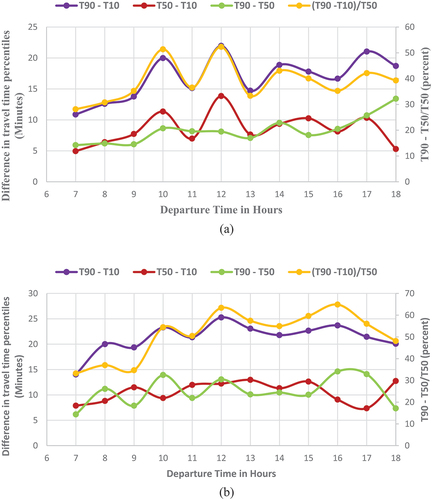
Figure 4. Coefficient of variation based day to day variability of trotro travel times in both directions on route 1: (a) Adum to Ejisu (b) Ejisu to Adum.
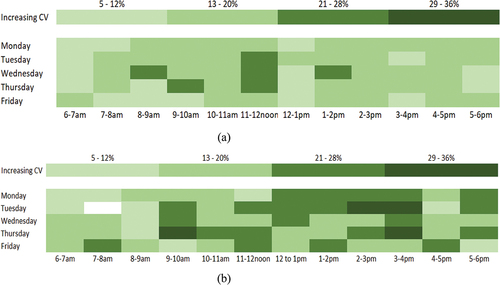
Table 3. Kolmogorov Smirnov (KS) test for significant variation in trip times among weekdays in both directions of the study route.