Figures & data
Table 1. List of recent major flood events in India (source: NDMA).
Table 2. Literature review on various techniques used for sustainable supply chain management.
Figure 1. Study area map of Alappuzha district, Kerala.
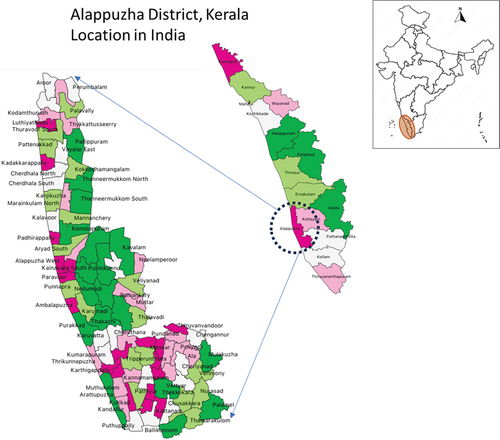
Figure 2. Land use distribution (in %) of Alappuzha district.
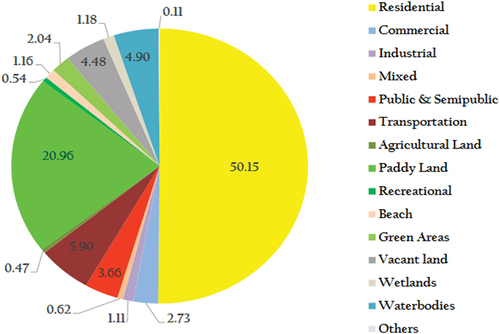
Figure 3. Road network (left) and relief camp density (right) maps in Alappuzha district.
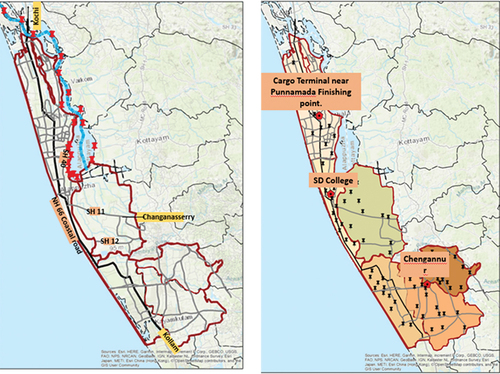
Figure 4. Detailed methodology.
Table 3. Scaling of FAHP.
Figure 5. FAHP methodology.
Table 4. Scaling of BWM.
Figure 6. Hierarchical structure of criteria selection.
Table 5. Sampling.
Table 6. Pairwise comparison matrix of sub criteria with respect to commodity.
Table 7. Pairwise comparison matrix of sub criteria with respect to cost.
Table 8. Pairwise comparison matrix of sub criteria with respect to cost.
Table 9. Pairwise comparison matrix of sub criteria with respect to Infrastructure.
Table 10. Pairwise comparison matrix of sub criteria with respect to location.
Figure 7. FAHP result weights.
Table 11. Pairwise comparison matrix of Commodity.
Table 12. Pairwise comparison matrix of Cost.
Table 13. Pairwise comparison matrix of transportation.
Table 14. Pairwise comparison matrix of Infrastructure.
Table 15. Pairwise comparison matrix of location.
Figure 8. FAHP and BWM result comparison.
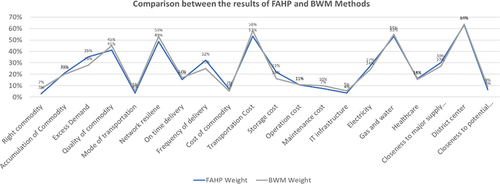
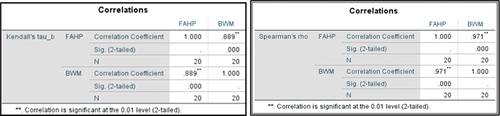
Figure 9. Statical test results.