
Figures & data
Table 1. Descriptive statistics of the model variables.
Figure 1. Safety perception by gender.
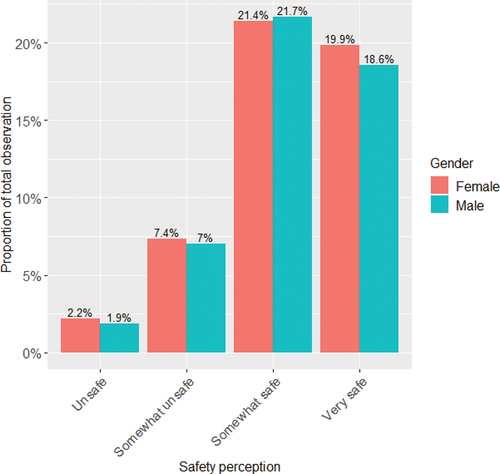
Figure 2. (a) safety perception by age group, (b) safety perception by walking duration to the bus stop.
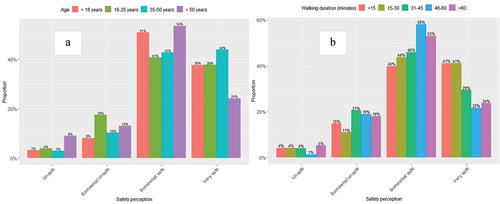
Figure 3. (a) safety perception by employment status, (b) safety perception by net monthly income.
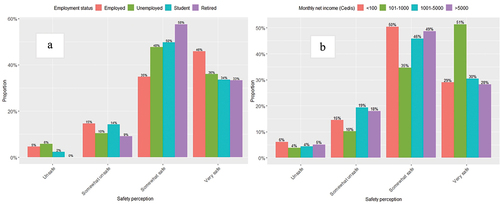
Figure 4. Pseudo elasticities of socio-demographic factors in the model.
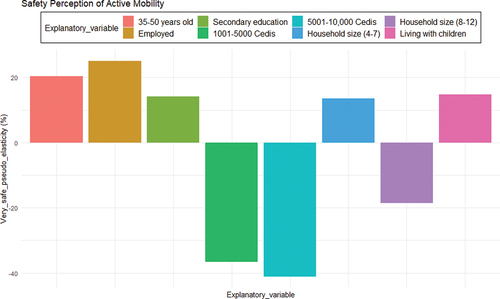
Table 2. Model estimates.
Data availability statement
The study data and relevant survey questions will be made available upon reasonable request from the corresponding author.