
Figures & data
Table 1. List of travel behaviour theories on NMT user behaviour.
Figure 1. Hypothesis model for intentions to use bike share.
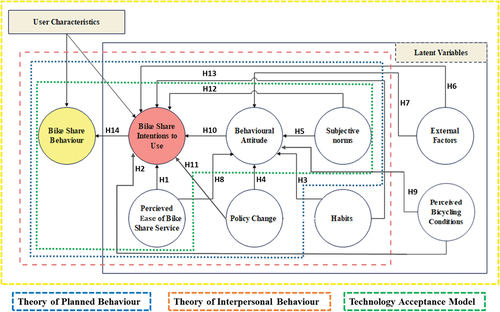
Table 2. List of the hypotheses.
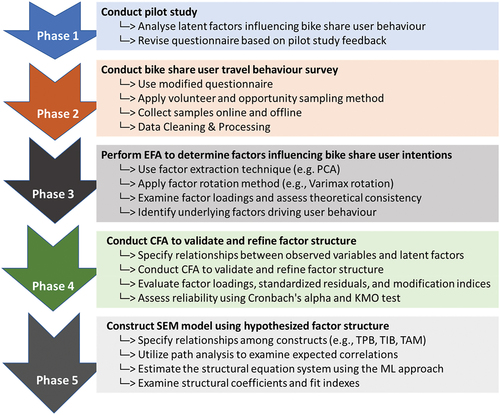
Figure 2. Research methodology.
Table
Table 3. Demographics and relevant frequency statistics of bike share user respondents.
Table 4. Mean scores, standard Deviation values for behavioural attitude (BA) scale.
Table 5. Mean scores, standard Deviation values for perceived ease of use (PE) scale.
Table 6. Mean scores, standard Deviation values for habits scale.
Table 7. Mean scores, standard Deviation values for subjective norms (SN) scale.
Table 8. Mean scores, standard Deviation values for policy support (PC) scale.
Table 9. Mean scores, standard Deviation values for Perceived Bicycling Conditions (PBC) scale.
Figure 3. Path diagram of Confirmatory factor Analysis.
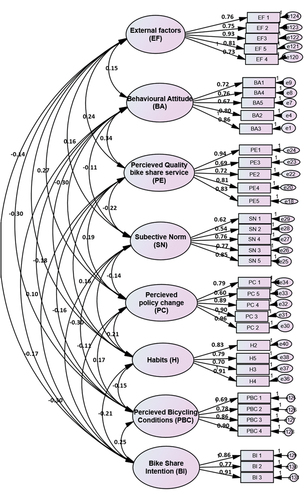
Figure 4. Path diagram of Structural equation of bike share user intention.
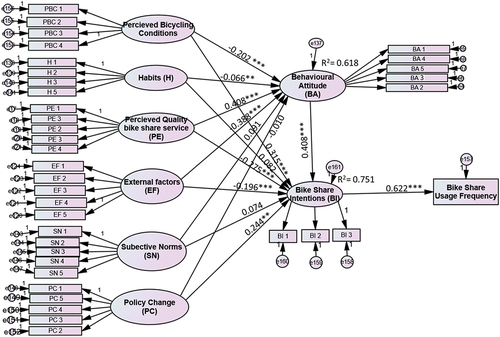
Table 10. Results of confirmatory factor analysis.
Table 11. Goodness of model fit statistics of Structural model.
Table 12. Path coefficients of the structural model.
Table 13. Effects of different variables on the intention to use bike share.
Table A1. Description of latent variables used SEM model.