Figures & data
Figure 1. Location of study area. Source: US Geological Survey (USGS) (http://glovis.usgs.gov).
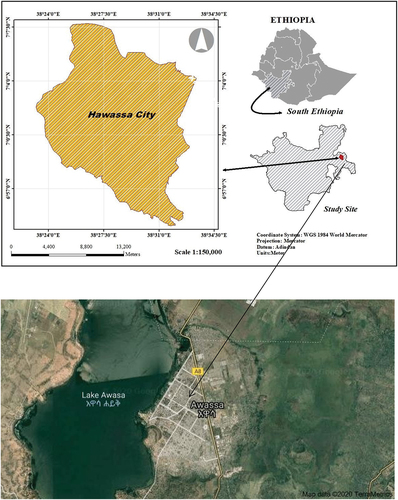
Table 1. Details of acquired satellite imageries.
Figure 2. Data processing flow chart. Source: Author’s construct, 2020.
Figure 3. Classified LULC maps of Hawassa city for years 1990, 2000, 2010 and 2020.
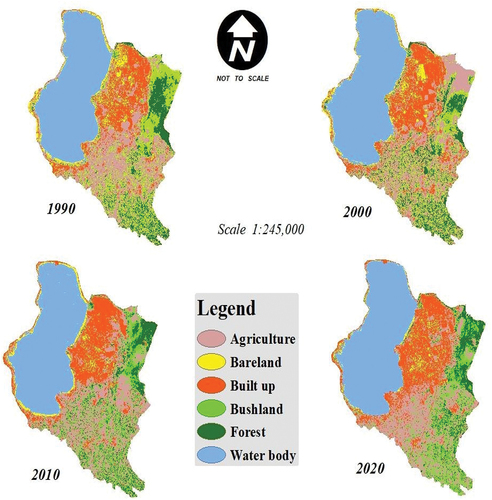
Table 2. Area statistics of LULC of years 1990, 2000, 2010 and 2020.
Figure 4. Net gain and loss of each LULC classes from other land uses for the period of 1990 and 2020. Source: [60] US Geological Survey (USGS) ().
![Figure 4. Net gain and loss of each LULC classes from other land uses for the period of 1990 and 2020. Source: [60] US Geological Survey (USGS) ().](/cms/asset/d08ccbf7-fc6e-4f36-96e7-d8ae44b13688/rupt_a_2281989_f0004_oc.jpg)
Table 3. Accuracy assessment of classified LULC maps of years 1990, 2000, 2010 & 2020.
Figure 5. Spatial distribution of NDBI 1990–2020. Source: US Geological Survey (USGS) (http://glovis.usgs.gov).
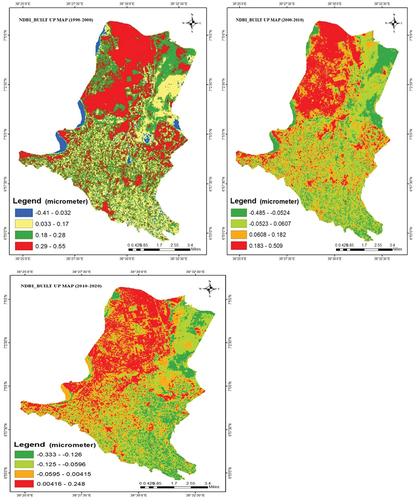
Figure 6. Spatial distribution of NDVI 1990–2020. Source: US Geological Survey (USGS) (http://glovis.usgs.gov).
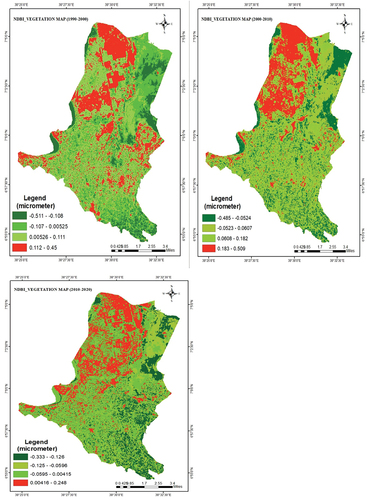
Figure 7. Land use/land cover conversion matrix from 1990 to 2020. Source: US Geological Survey (USGS) (http://glovis.usgs.gov).
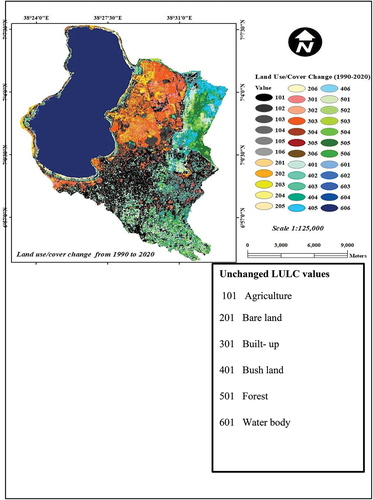
Figure 8. Business land use zoning. Source: hawassa city Municipality.
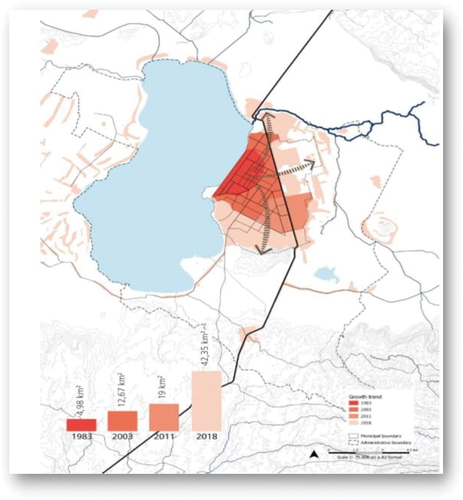
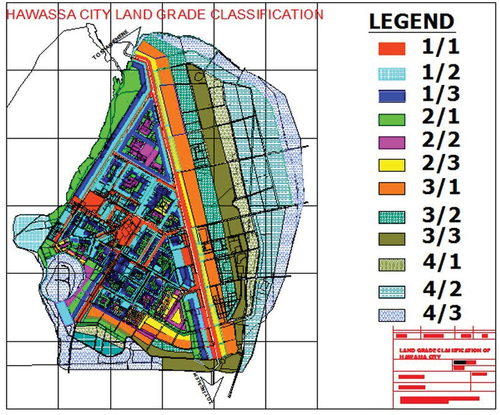
Figure 9. Map of existing land grading in 1983, 2003, 2011 and 2018. Source: hawassa city Municipality.