
Figures & data
Figure 1. Location map of the study area.
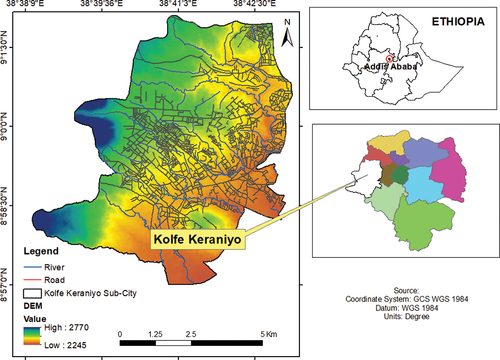
Figure 2. Qualified segments and traffic points in the study area (morning).
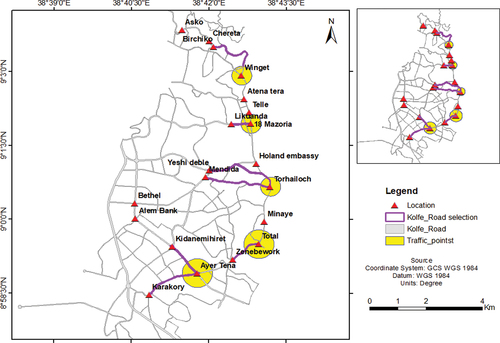
Figure 3. Qualified segments and traffic points in the study area (evening).
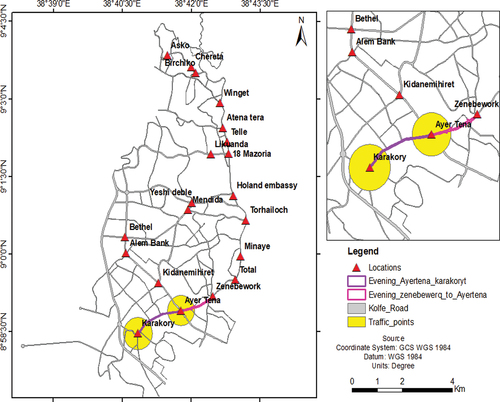
Table 1. Population and sample size of the study population.
Table 2. Description of variables.
Table 3. Descriptive characteristics of the respondents.
Table 4. Perceived socio-economic impact (1) = strongly disagree, (2) = disagree, (3) = neutral, (4) = agree, (5) = strongly agree.
Table 5. Major/An essential socio-economic impact.
Table 6. Parameter estimates of ordinal logistic regression.