
Figures & data
Table 1. Study constructs and items (indicators) source: field survey 2022.
Figure 1. Proposed economic wellbeing model. Source: authors’ design.
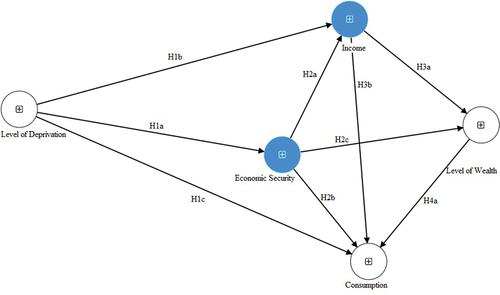
Figure 2. A location map of the case study area in Kumasi, Ghana. In the second and small map, the purple color represents the Kumasi metropolis and blue indicates the Kejetia New market area. Source: Mensah et al., Citation2022.
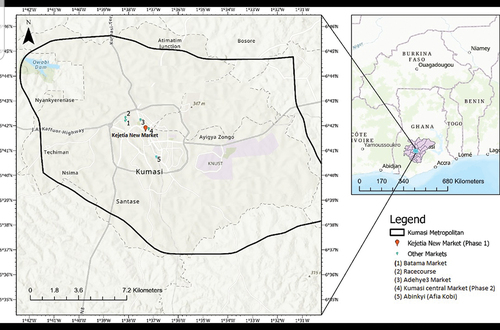
Table 2. Descriptive profile of respondents. Source: authors’ design.
Table 3. Construct and indicators reliability and validity. Source: authors design.
Table 4. Heterotrait-monotrait ratio (HTMT). Source: authors’ design (SMART PLS 4.0).
Figure 3. The structural model with path coefficient, item loadings, and R square. Source: authors design.
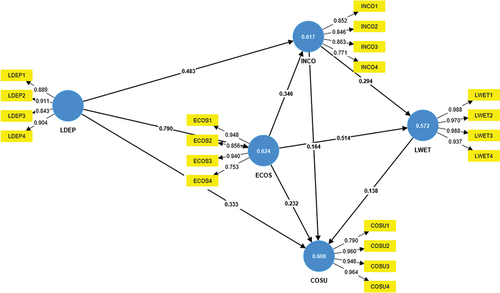
Table 5. Significance of path coefficient and hypotheses.
Data availability statement
The data supporting the findings of this study is available in the supplementary link.