
Figures & data
Figure 1. Location map of the study area.
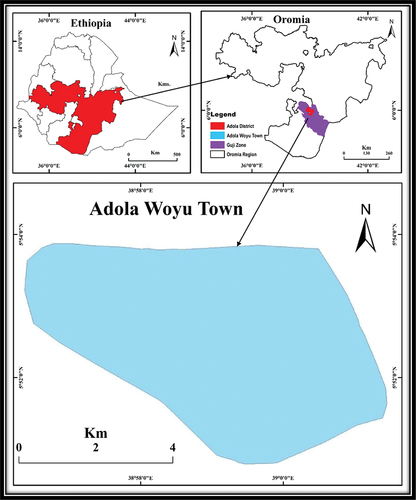
Figure 2. Elevation map.
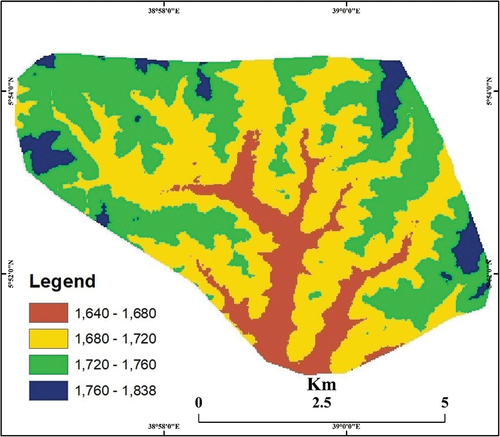
Figure 3. Slope map.
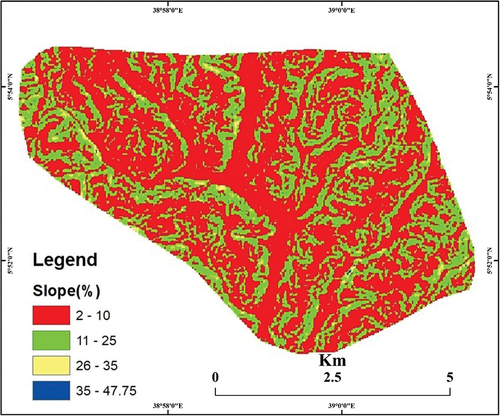
Figure 4. Land use map.
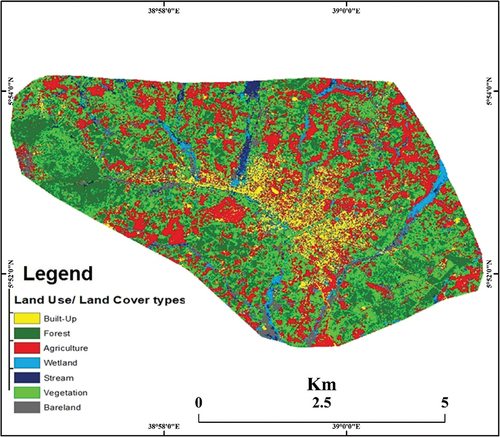
Table 1. Sources of data used in the study.
Table 2. The preference scale for pair-wise comparison in AHP.
Figure 5. General work flow of the study.
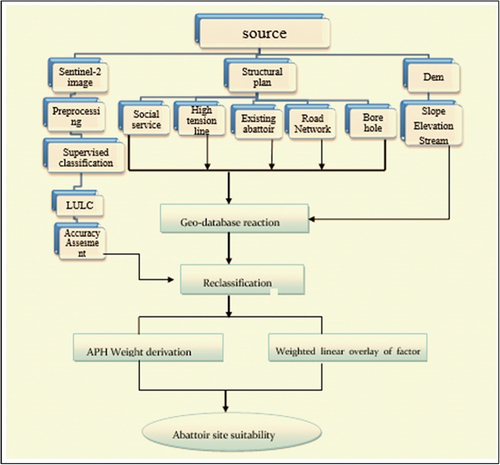
Figure 6. Existing abattoir surround.
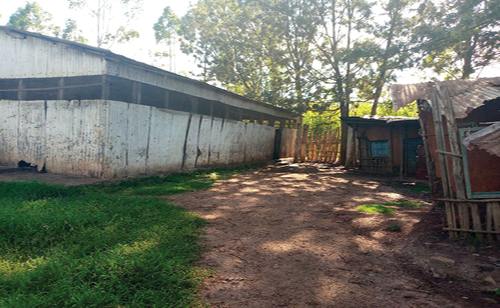
Figure 7. Existing abattoir inside the fence.
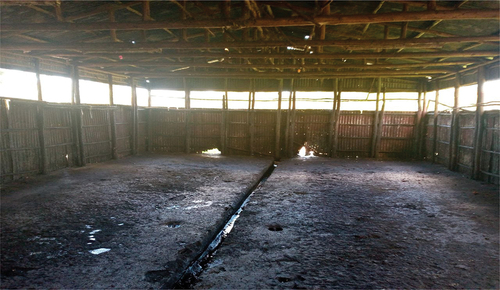
Figure 8. Solid waste disposal around the existing abattoir.
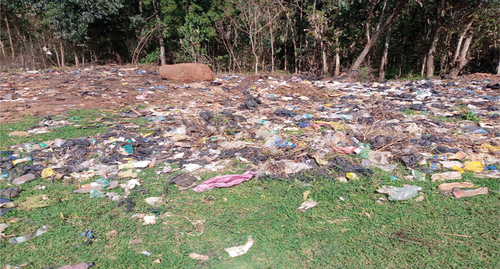
Figure 9. Waste from the existing abattoir in town.
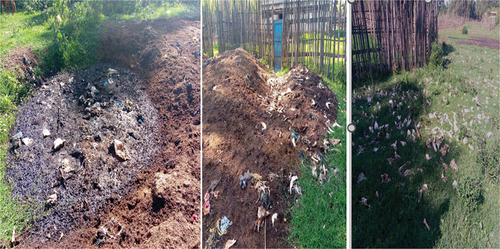
Table 3. The criteria for the suitability of the abattoir location.
Figure 10. Major land use types classified from the sentinel-2A image.
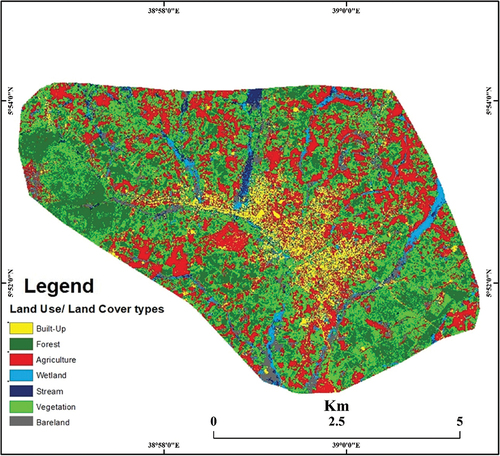
Figure 11. The reclassified land use map of the study area.
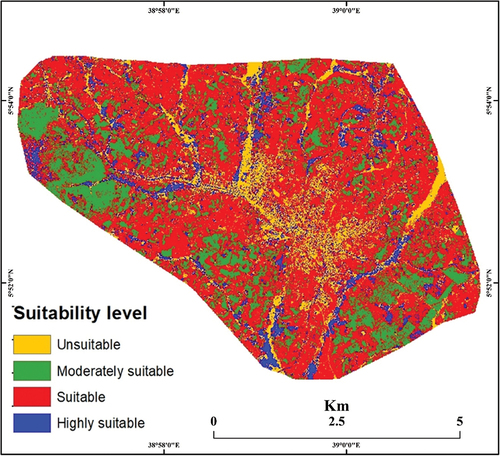
Table 4. Error matrix showing classification accuracy of the true land cover.
Table 5. Users and producers’ accuracy.
Table 6. Reclassified land use.
Figure 12. Reclassified elevation map generated from DEM.
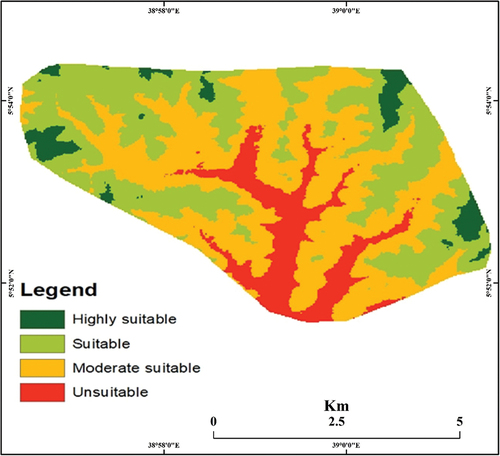
Table 7. Reclassified elevation values.
Figure 13. Reclassified slope map generated.
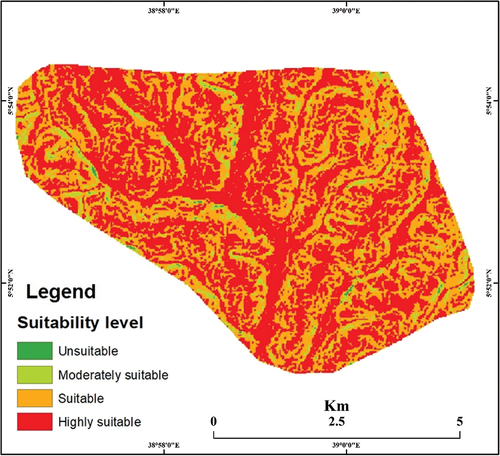
Table 8. The reclassified slope suitability class.
Figure 14. Reclassified road map digitized from the structural plan of the town.
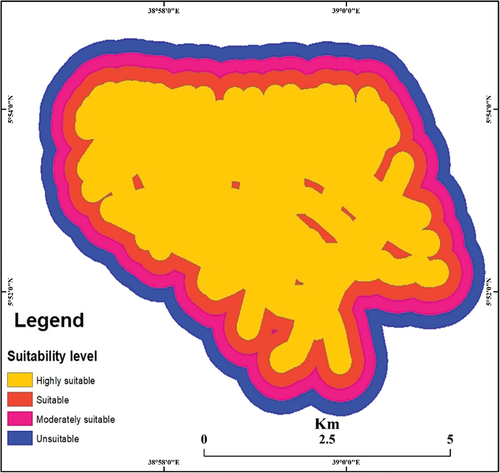
Table 9. Reclassified distance of main road networks.
Figure 15. Reclassified map of the streams.
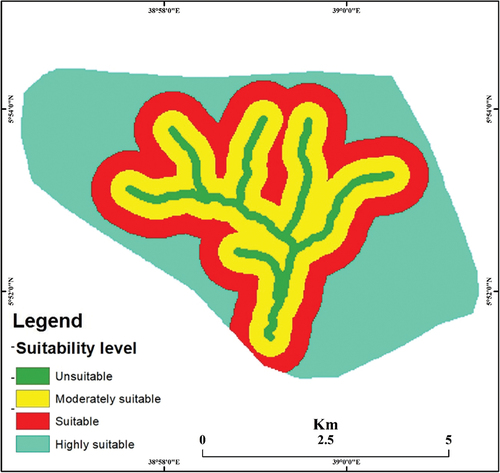
Table 10. Reclassified distance from streams.
Figure 16. Reclassified map of social services.
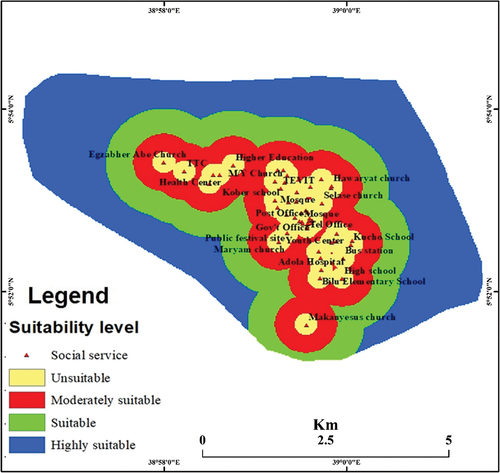
Table 11. Reclassified distances from social services.
Figure 17. Reclassified map of the boreholes.
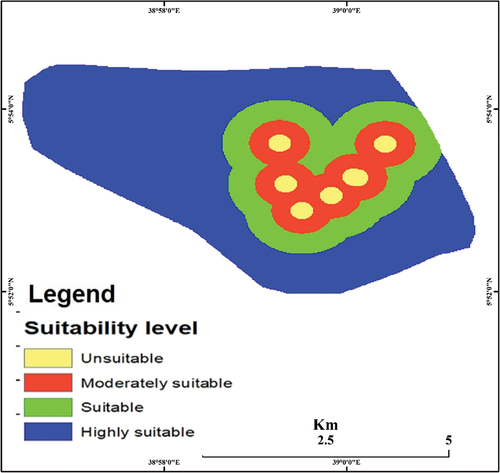
Table 12. Reclassified distances from boreholes.
Figure 18. Reclassified map of the high-tension line.
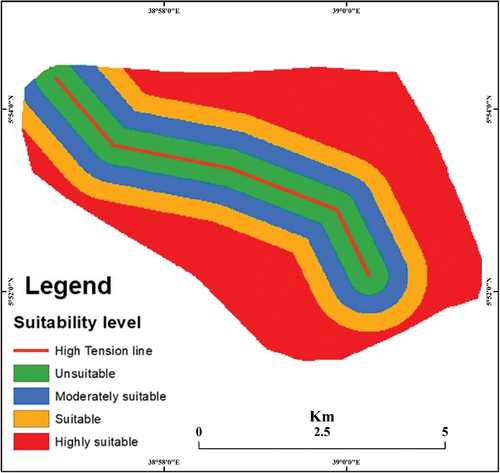
Table 13. Reclassified distances from the high-tension line.
Table 14. Pair-wise comparison, 9-point weighting scale.
Figure 19. Abattoir site suitability analysis model builders.
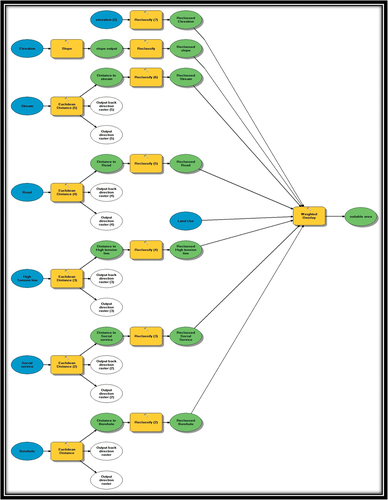
Table 15. Pair-wise comparison of weighting scale.
Table 16. Normalized pair-wise comparison matrix.
Table 17. Random index value.
Table 18. Classification of factor values and their weights obtained after pair-wise comparison.
Table 19. Statistical analysis for the abattoir site suitability map.
Figure 20. Suitability map of the abattoir.
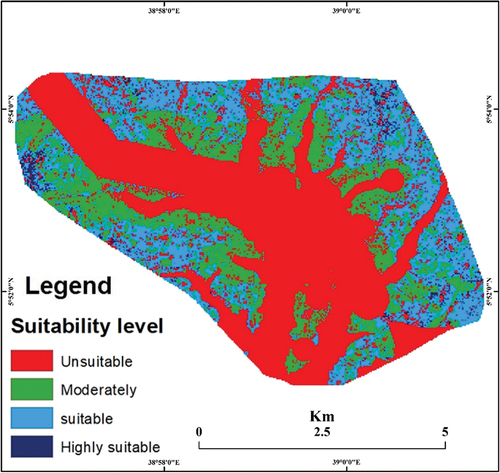
Figure 21. Suitability map of an abattoir overlaid by factor layers.
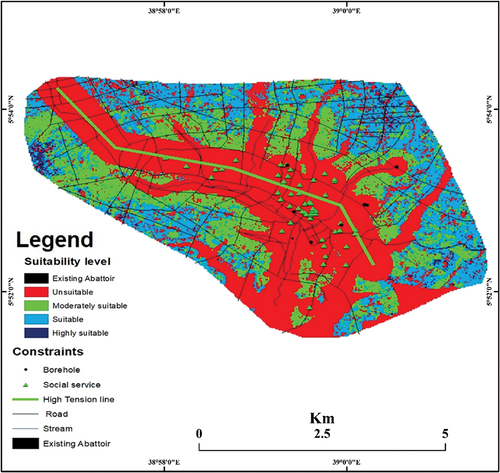
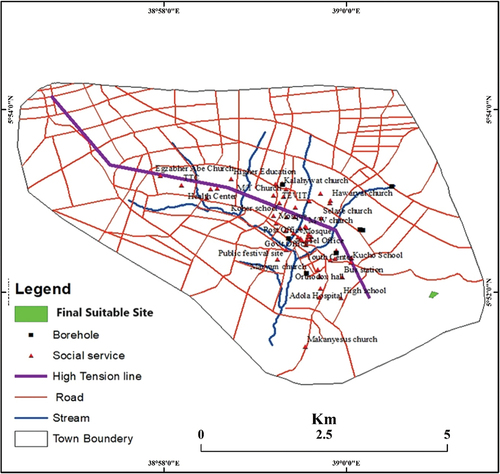
Figure 22. Optimal filtered final selected site.
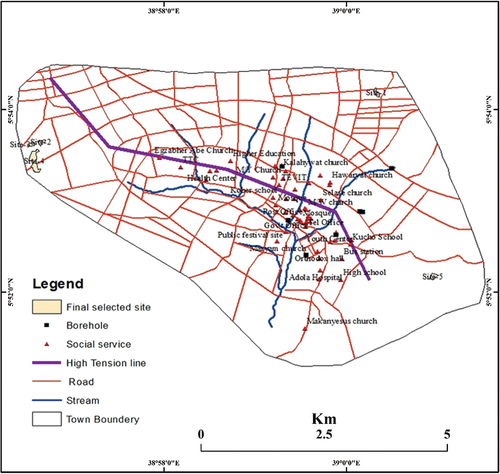
Table 20. Comparison of the various requirements for the abattoir’s final location.
Figure 23. The final selected suitable site for the abattoir.
Data availability statement
The data supporting the results of this study are available at reasonable request from the corresponding author.