
Figures & data
Figure 1. Location map of the study area.
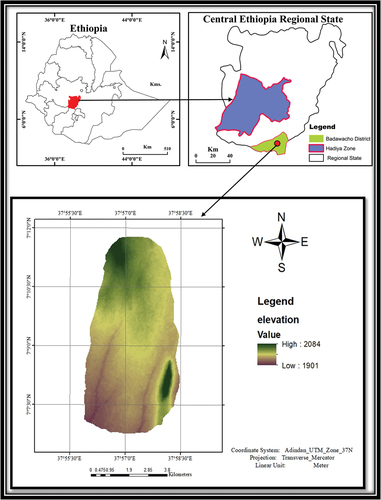
Figure 2. Elevation map of the study area.
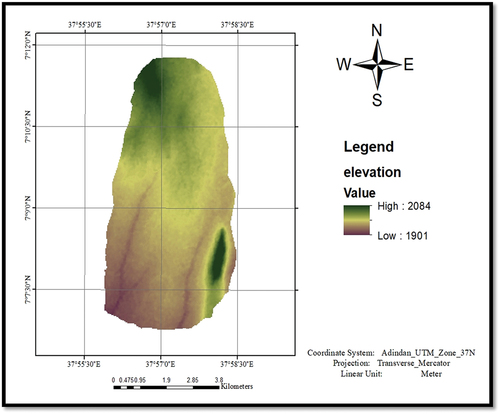
Figure 3. Slope map of the study area.
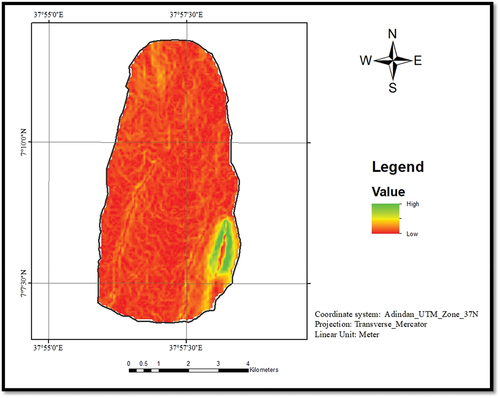
Figure 4. Annual distribution of rainfall in the study area.
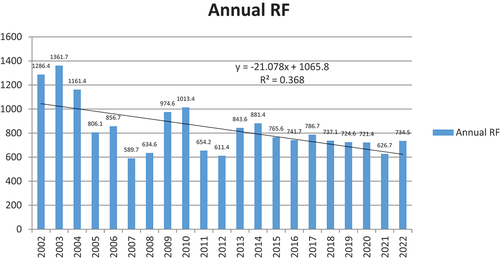
Figure 5. Trend analysis of the maximum, minimum, and mean annual temperatures of the study area (2002–2022).
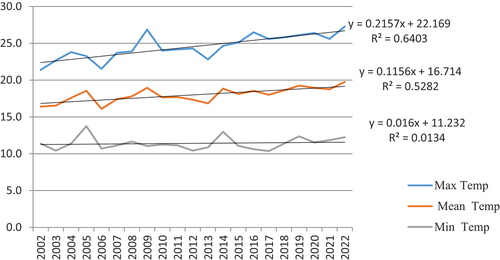
Table 1. Sources and types of data.
Figure 6. General workflow of the study.
Figure 7. Temporary existing open solid waste dumping site (field survey, 2023).
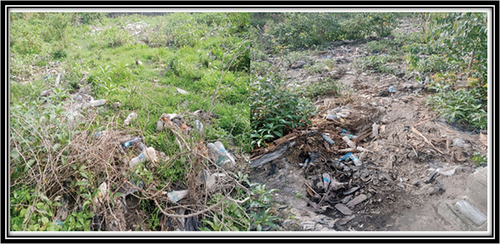
Figure 8. Waste sprayed around the road and residential areas (field survey, 2023).
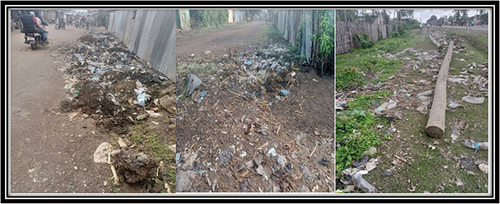
Figure 9. Waste covered the drainage and residential areas (field survey, 2023).
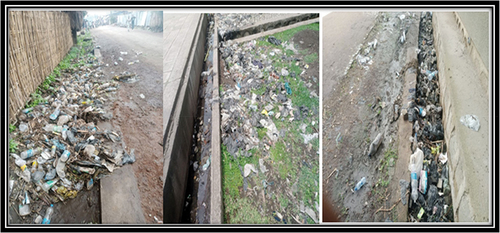
Figure 10. Waste was irregularly thrown at water-logged areas near residences (field survey, 2023).
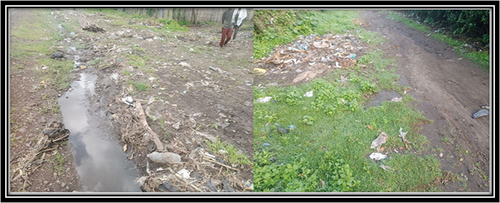
Figure 11. Slope suitability map.
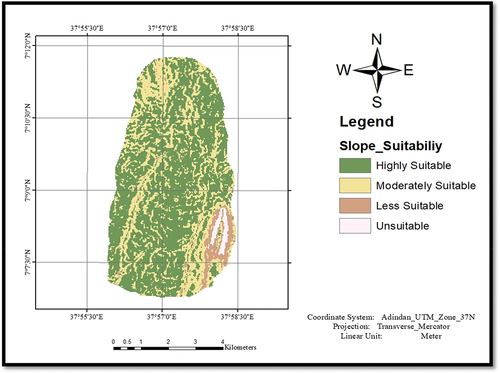
Table 2. Slope suitability class.
Figure 12. Road suitability map.
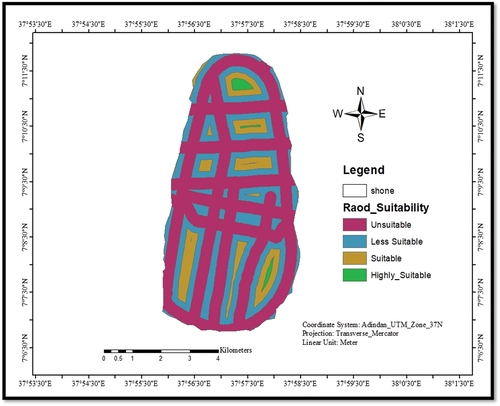
Table 3. Road suitability class.
Figure 13. Stream suitability map.
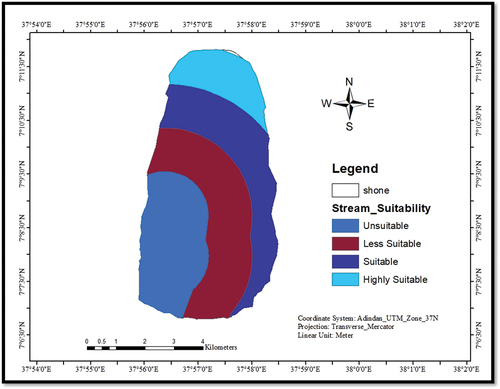
Table 4. Stream suitability class.
Figure 14. Soil suitability map.
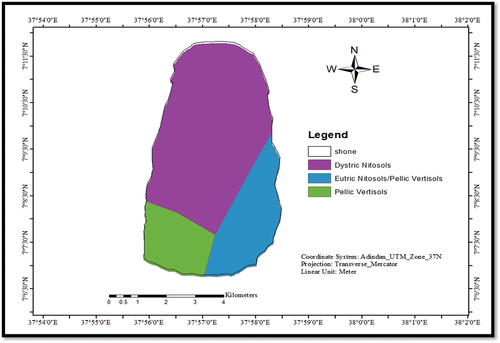
Table 5. Soil suitability class.
Figure 15. Protected area suitability map.
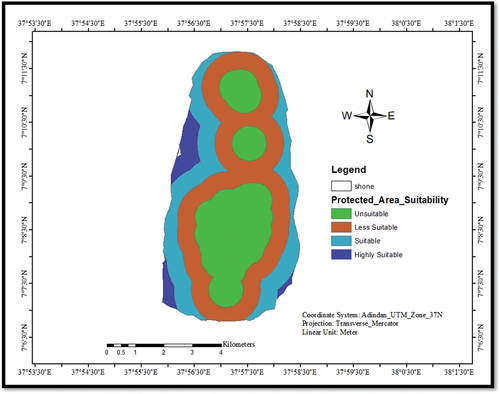
Table 6. Protected area suitability class.
Figure 16. Settlement suitability map.
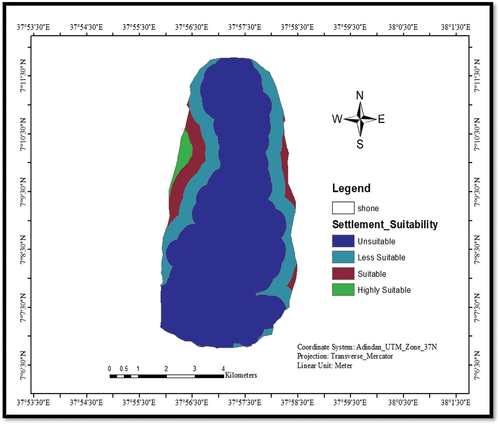
Table 7. Settlement suitability class.
Figure 17. Borehole suitability map.
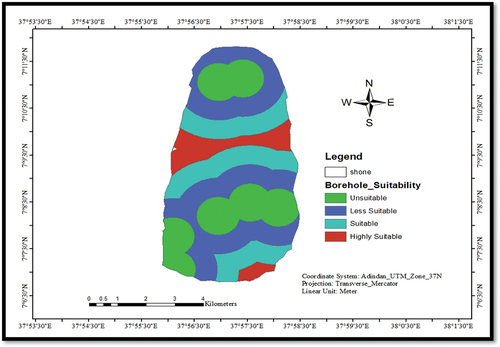
Table 8. Borehole suitability class.
Figure 18. Geological suitability map.
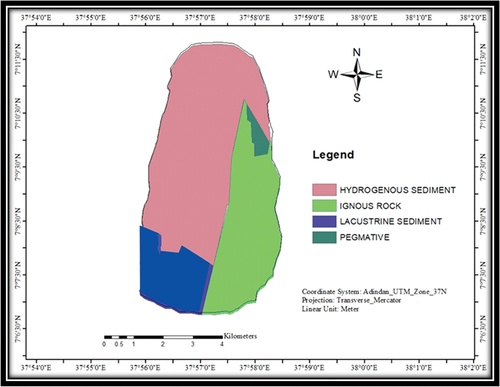
Table 9. Geological suitability class.
Figure 19. Urban land use suitability map.
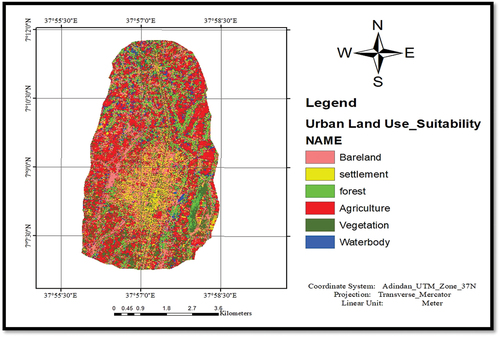
Table 10. Urban land use suitability class.
Table 11. Error matrix showing classification accuracy of the true land cover.
Table 12. Confusion matrix accuracy technique between the land cover dataset and ground truth data.
Table 13. Provides a random index for the number of elements and criteria.
Table 14. Pair-wise comparison on seven-point continuous scales.
Table 15. Weight of consideration for choosing a suitable solid waste disposal site.
Figure 20. Landfill suitability map.
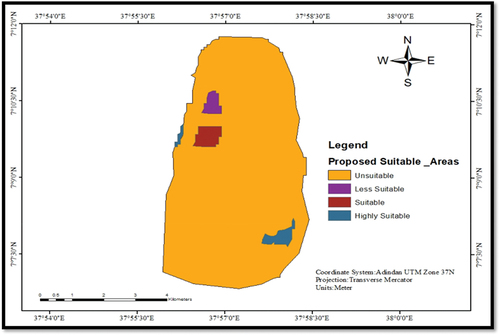
Table 16. Landfill suitability.
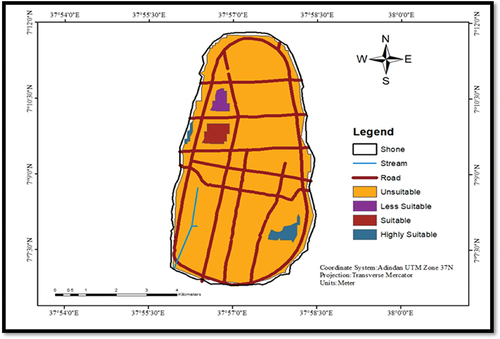
Figure 21. Overall landfill suitability map.
Data availability statement
The data supporting the results of this study are available at reasonable request from the corresponding author.