
Figures & data
Figure 1. Flowchart of the research methodology (Authors’ design).
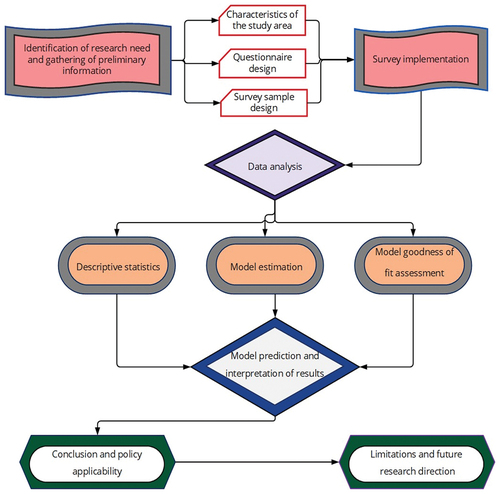
Figure 2. Study area and sampling locations.
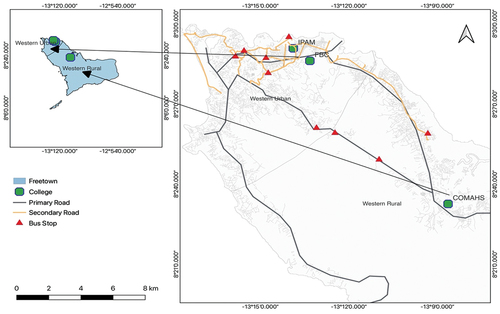
Table 1. Model estimation parameters.
Table 2. Attributes of respondents.
Figure 3. (a) Distribution of students’ modal share (Source: Authors’ field data) (b) Current motorized transport modal split in Freetown (Source: Statistics Sierra Leone, 2015; 2017).
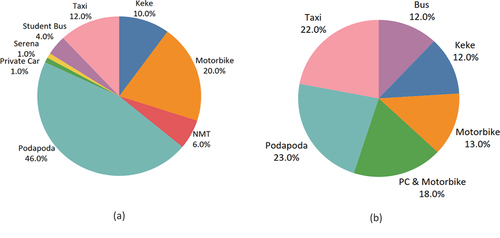
Figure 4. (a) Graphical representation of transport modes (b) Distribution between university campus and preferred mode (Source: Authors’ field data).
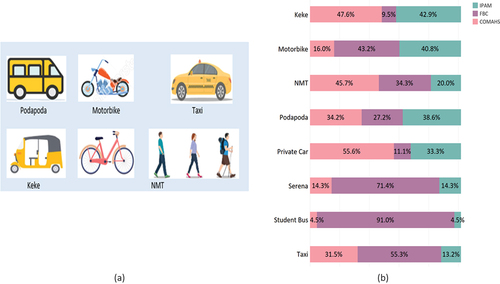
Figure 5. Perception of importance level toward factors affecting transportation mode choice (Source: Authors’ field data).
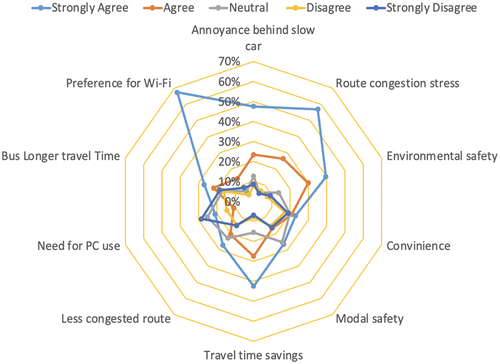
Table 3. Model estimation output.
Table 4. Model prediction results.
Table 5. Aggregate elasticity of public transport modes.
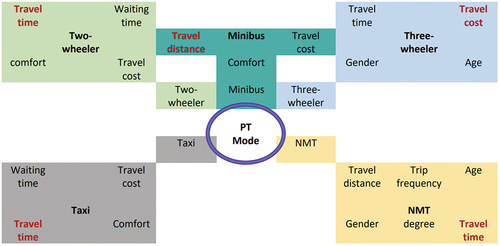
Figure 6. Factors that influence the choice of each PT mode (Source: Authors’ concept).
Data availability statement
The data presented in this study are available on request from the corresponding author.