
Figures & data
Figure 1. Flow chart of data collection methodology.
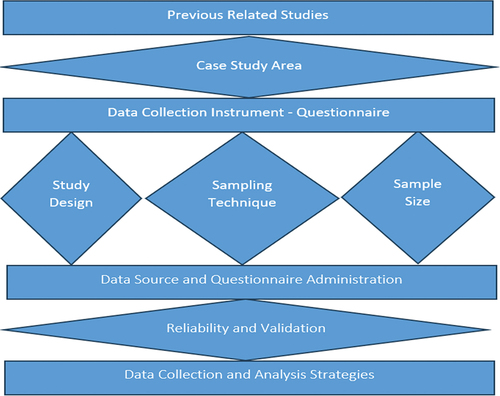
Figure 2. Map of Accra metropolitan area (Ghana Statistical Service [GSS], Citation2014).
![Figure 2. Map of Accra metropolitan area (Ghana Statistical Service [GSS], Citation2014).](/cms/asset/ff30f17e-bff3-46ce-b9d9-a358f18b660d/rupt_a_2305277_f0002_oc.jpg)
Figure 3. Religious representation in Ghana (Sasu, Citation2022b).
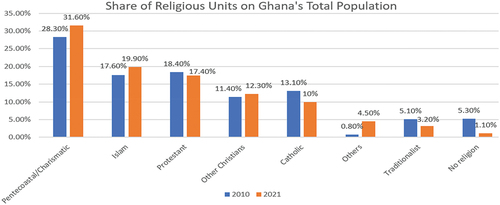
Table 1. Demographic, travel behaiour and religious & economic parameters of respondents.
Figure 4. Some PT users’ commentaries on return of lost items.
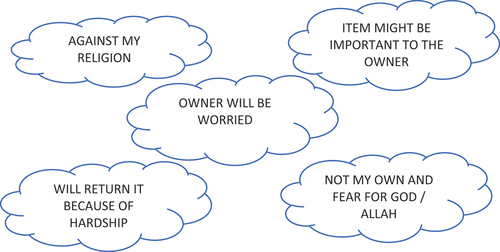
Figure 5. Some PT users’ commentaries not to return lost items.
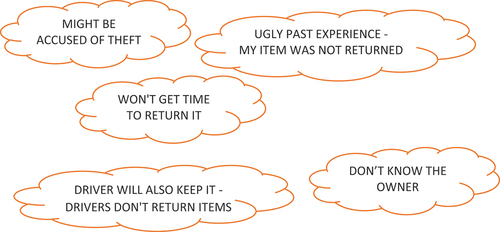
Table 2. Respondents most preferred trip types, transport mode and economic difficulties.
Figure 6. Graph of frequency of lost item against return of item.
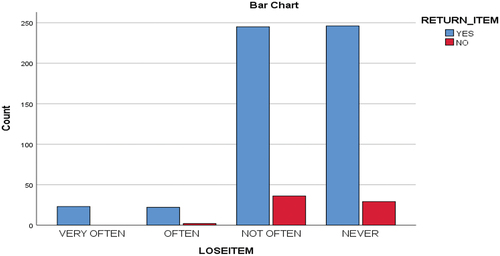
Figure 7. Graph of religious affiliation against return of item.
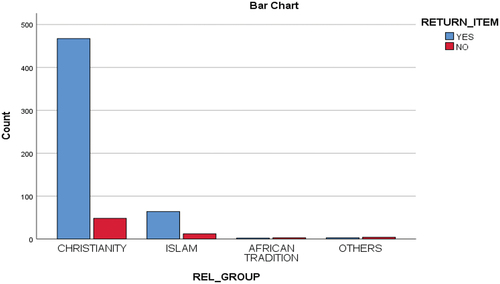
Figure 8. Graph of economic influence against return of item.
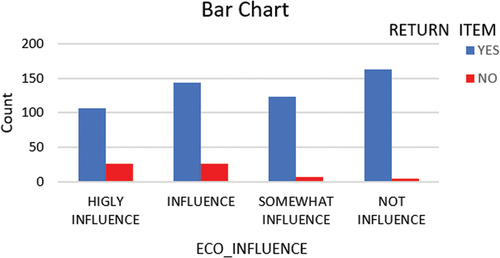
Table 3. Lose of items, religious group and economic influence against return of item.
Table 4. Factors that triggers decision to return or not return lost but found items by PT users.