
Figures & data
Table 1. List of cities with bike sharing schemes in India source: (primary survey by Author).
Figure 1. Spatial distribution of bicycle stations of public bike share schemes in Chandigarh.
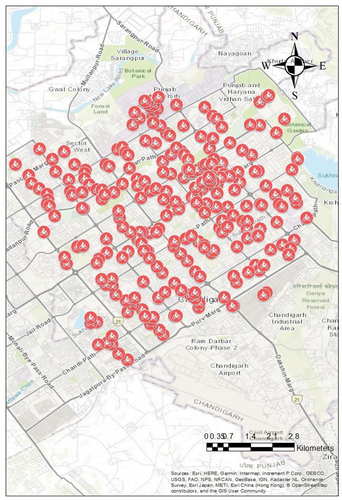
Figure 2. Mode wise (conventional bike & E bike) distribution of trips on different days and hours of day.
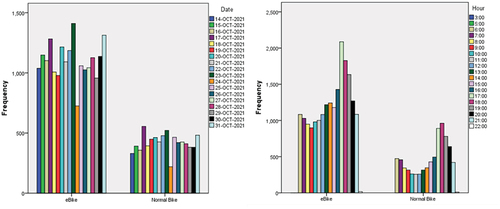
Figure 3. Distribution of travel time (in minutes) between conventional bike & E bike trips.
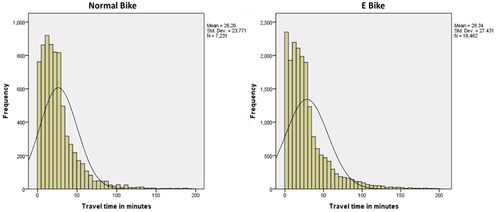
Table 2. Description of variables used in the MNL model.
Figure 4. Distribution of trips day of week (Weekend & Weekday) and hours of day (peak & off peak) an.
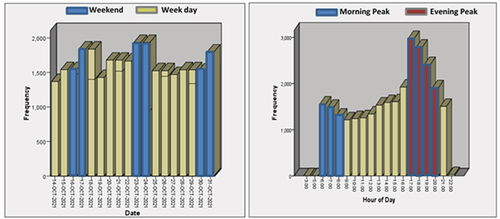
Figure 5. Hourly distribution of bike share trips on weekdays & weekends.
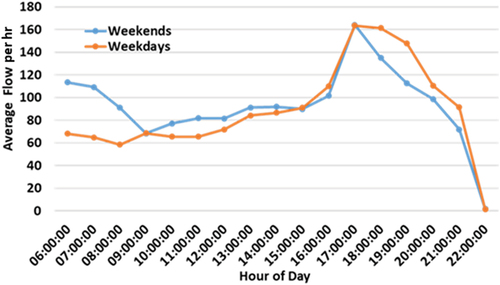
Figure 6. Mode wise hourly distribution of bike share trips on weekdays & weekends between E-bike and normal (pedal) bike.
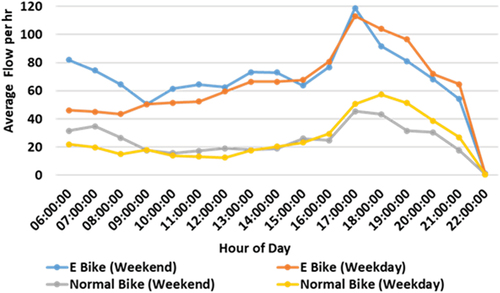
Figure 7. Hourly distribution of bike share trip durations on weekdays & weekends.
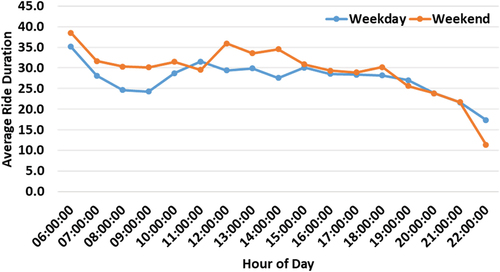
Figure 8. Mode wise hourly distribution of bike share trip durations on weekdays & weekends between E-bike and normal (pedal) bike.
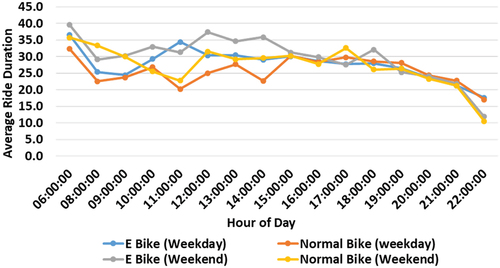
Table 3. Multinomial logistic regression model result for bike share ride duration.
Table 4. Binary logistic regression model result for (bicycle type choice) in bike share.