
Figures & data
Figure 1. Factors contributing to traffic-related air pollution (source; author).
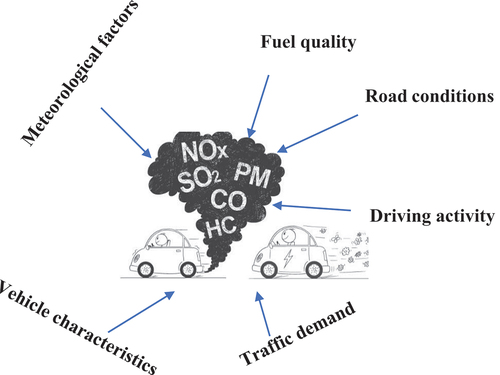
Figure 2. Age of the test vehicles.
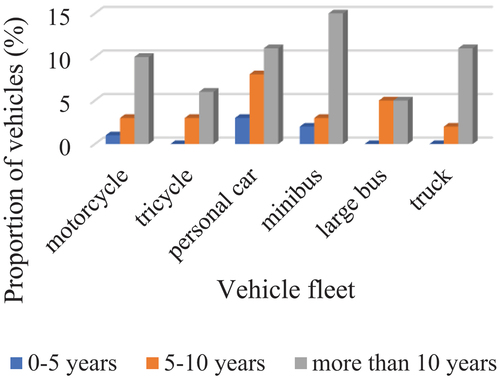
Table 1. Vehicle fleet and percentage by motorization, type and age.
Figure 3. Vehicle status at purchase.
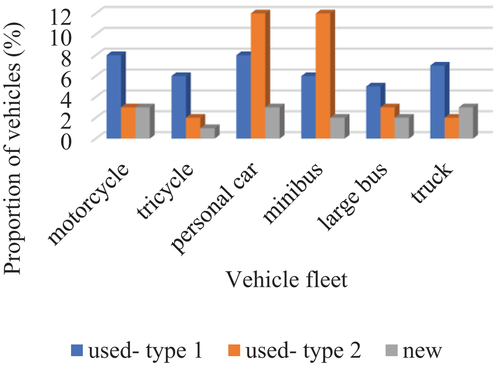
Figure 4. Effects of vehicle age on CO-emissions in petrol engine.
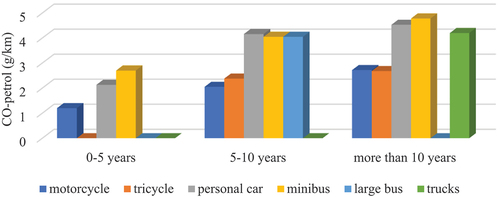
Figure 5. Effects of vehicle age on NOx-emissions in petrol engine.
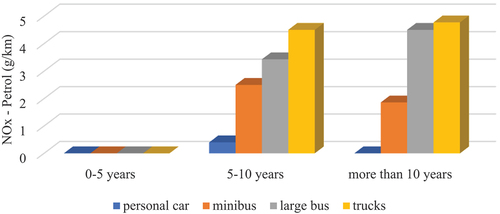
Figure 6. Effects of vehicle age on CO-emissions in diesel engine.
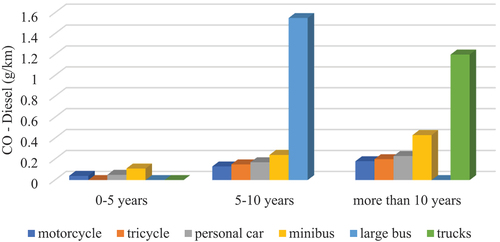
Figure 7. Effects of vehicle age on NOx-emissions in diesel engine.
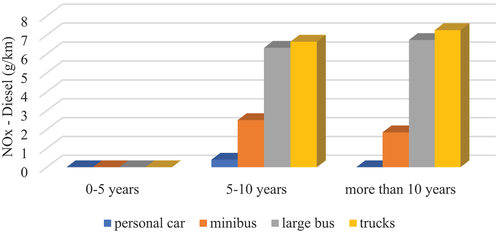
Figure 8. (a) Contribution of the vehicle fleet to petrol engine; (b) contribution of the vehicle fleet to diesel engine.
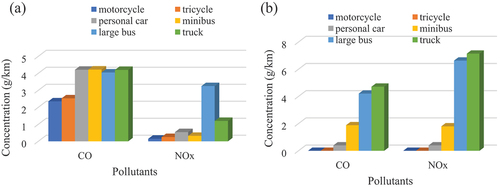
Table 2. Pollutants average concentration from the different engine vehicles.
Figure 9. (A) emission of CO and NOx for petrol engine; (b) emission of CO and NOx for diesel engine.
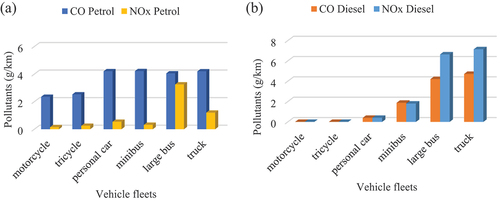
Figure 10. Total emission of CO and NOx gases for the test vehicles.
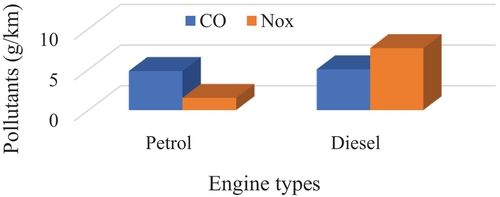
Figure 11. (A) total emission of CO for petrol engine; (b) total emission of NOx for petrol engine; (c) total emission of CO for the diesel engine; (d) total emission of NOx for diesel engine.
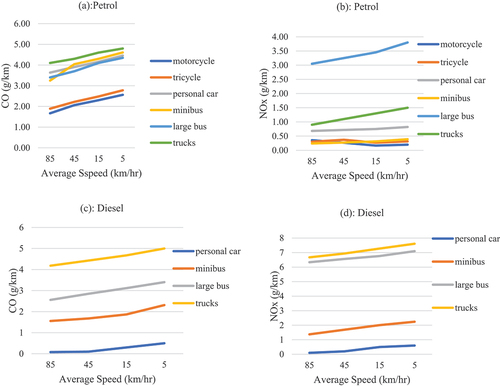
Table 3. Spearman’s correlation measures the variables.
Table 4. Coefficients for the model equation – NOx
Table 5. Coefficients for the model equation – CO.
Table 6. Model summary
Table 7. Model assessment by ANOVA- CO.
Table 8. Model assessment by ANOVA- NOx.
Table 9. Average emission for CO and NOx and their emission standards.