
Figures & data
Table 1. Recent research on speed variation using a data-driven approach.
Figure 1. Study area.
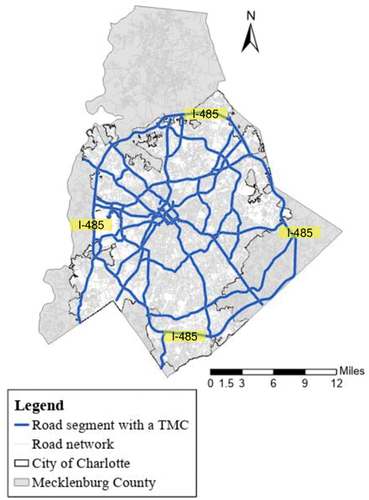
Table 2. Data summary.
Figure 2. Variation of the mean speed interval across months and times of the day.
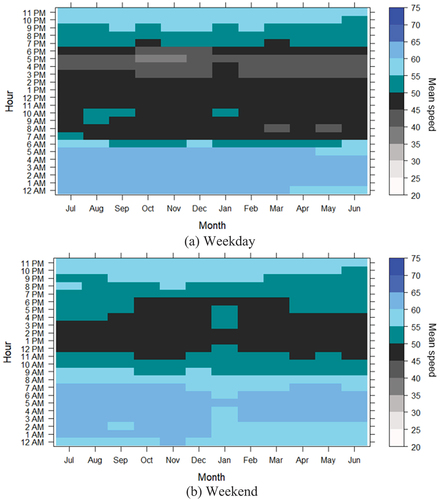
Table 3. Summary statistics of traffic speeds (mph).
Table 4. Summary statistics of traffic speeds (mph) for 25 mph or 30 mph posted speed limit road links.
Table 5. Summary statistics of traffic speeds (mph) for 35 mph or 40 mph posted speed limit road links.
Table 6. Summary statistics of traffic speeds (mph) for 45 mph or 50 mph posted speed limit road links.
Table 7. Summary statistics of traffic speeds (mph) for 55 mph or 60 mph posted speed limit road links.
Table 8. Summary statistics of traffic speeds (mph) for 65 mph or 70 mph posted speed limit road links.
Figure 3. Correlations of traffic speed measures for weekdays.
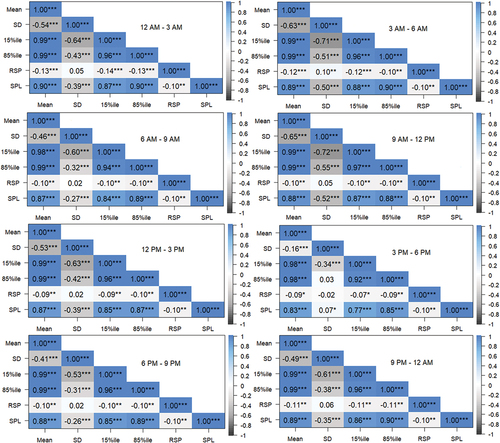
Table 9. Correlations between traffic speed measures for weekdays (12 PM to 3 PM).
Figure 4. Speed variations for weekdays between 9 AM and 12 PM.
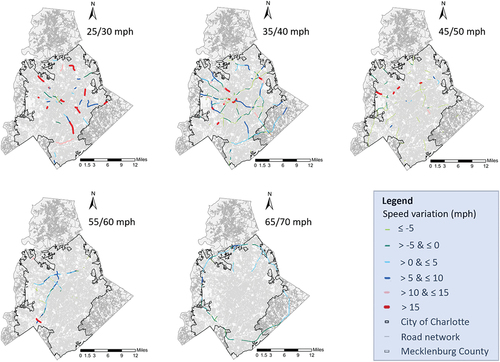
Table 10. 65/70 mph posted speed limit road links of high-speed variations.
Figure 5. Skewness-kurtosis plot for traffic speeds on the road link “125N10200” during the weekend time interval of 3 PM to 6 PM.
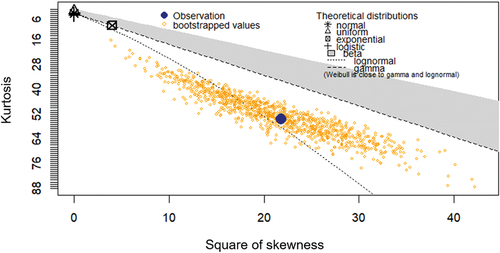
Figure 6. Goodness-of-fit plots of the candidate distributions fitted to the weekend time interval (3 PM to 6 PM) traffic speeds on the road link “125N10200”.
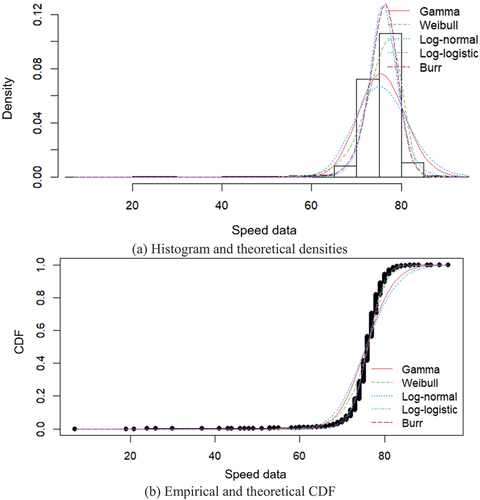
Table 11. Comparison of goodness-of-fit results for the weekend time interval (3 PM to 6 PM) traffic speeds on the road link ‘125N10200’.