
Figures & data
Table 1. Data types and variables description.
Figure 1. Study location (Akure north local government area–rural area).
Source: ARCGIS (2022).
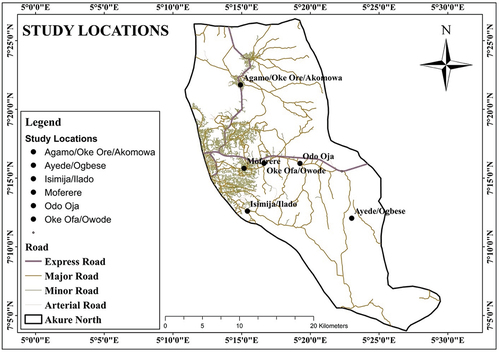
Figure 2. Study location (Akure south local government area–urban area).
Source: Author’s Field Work (2022)
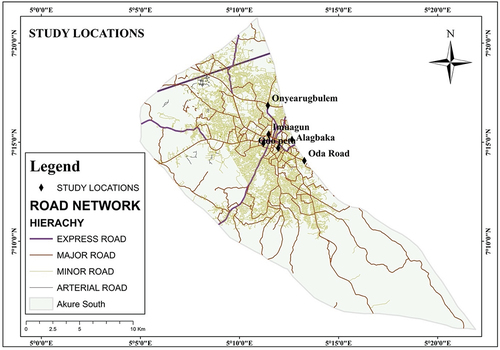
Table 2. Factors influencing telecommunication usage of respondents in the rural areas.
Table 3. Model summary (rural area).
Table 4. Factors influencing telecommunication usage of respondents in the urban area.
Table 5. Model summary (urban area).
Table 6. Average Trips Complemented, substituted and induced by telecommunication in the study areas.
Table 7. Average daily trip activities complemented, substituted and induced by the use of telecommunication in the urban and rural areas.