
Figures & data
Figure 1. Map of the Accra Metropolis showing the survey locations.
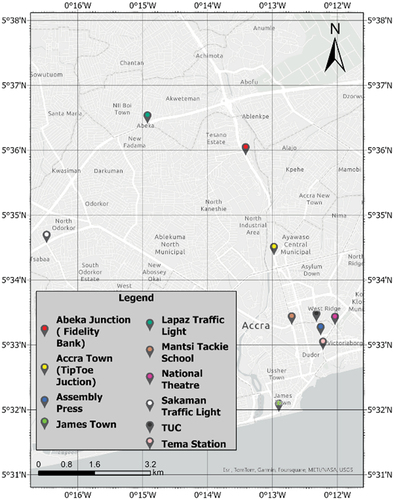
Figure 2. Distribution of pedestrian red-light violations classified by (a) the number of lanes and (b) the type of junction.
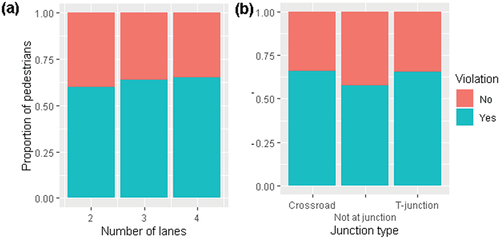
Table 1. Descriptive statistics of the pedestrian red-light violations classified by other measured variables considered.
Table 2. Estimated parameters for the mixed-effect logistic regression model for pedestrian red-light violation.
Table 3. Performance comparison between the fitted mixed-effect logistic regression model and the standard logistic regression model.