
Figures & data
Table 1. Combinations used with different individual dependent variables for model validation.
Table 2. ST/DT values and truck distribution for different stall categories.
Figure 1. (a) Clockwise from left: Spatial distribution of month-wise truck demand; (b) Determining the planning period based on truck demand; (c) Fair timeline schedule of all the fairs within the planning period.
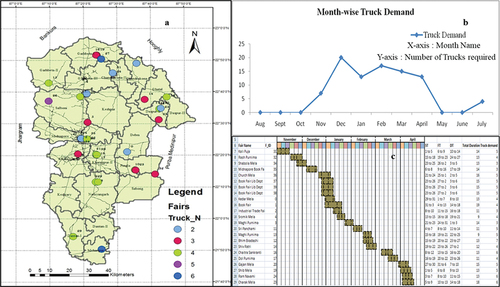
Figure 2. OD pairs in terms of distances of all the fair location nodes.
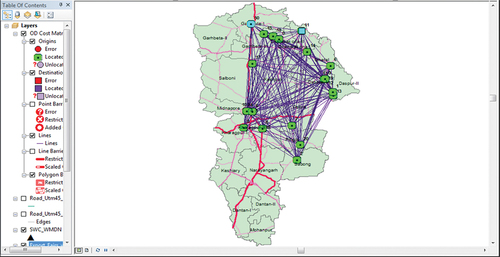
Figure 3. Clockwise from left (a) VRP output map for one origin and three destination fairs on day 53. Three routes are generated for the given day that require delivery to 3 distinct locations. (b) VRP output map for single-origin and single destination on day 107. A single route is generated for the given day. (c) The output table shows the total distance and time for the entire operation within the day. (d) VRP output map for a single origin and single destination on day 167.
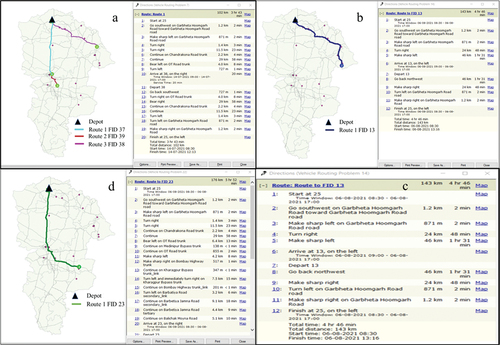
Table 3. Parameter comparison under different truck systems.
Table 4. Income and expenses incurred under different scenarios.
Table 5. Cost of operating a 5.49 m LPT truck per kilometre under different parameters.
Table 6. Cost break-up of all the items used to calculate the procurement, delivery and operational cost of trucks. Storage Tariff circular of WBSWC.
Figure 4. Cost calculation methodology adopted for the existing system for all the stalls.
Table 7. Parameters that are considered for calculation of the cost incurred in each system. Systems denote existing and proposed scenarios. Some parameters were used in either one of the systems, whereas some parameters were used in both systems as shown [Source: Primary survey 2018–2019].
Table 8. Transportation cost comparison under BAU and proposed scenario.
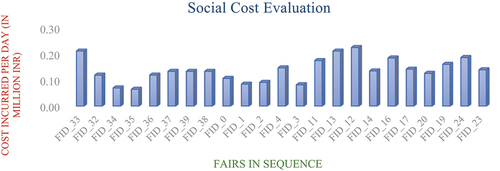
Figure 5. Estimated social cost incurred for each fair occurring in a sequence.
Data availability statement
There is no data set associated with this paper.