Figures & data
Figure 1. An overview of multi-modal transportation in Thailand’s EEC.
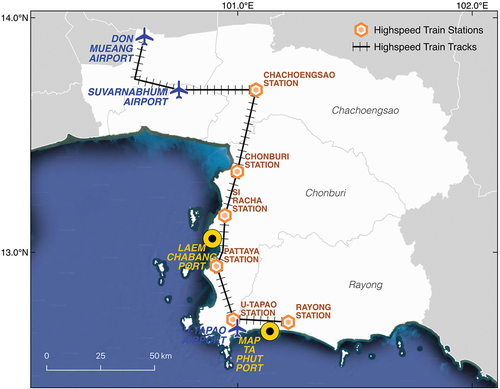
Figure 2. An overview of research methodology.
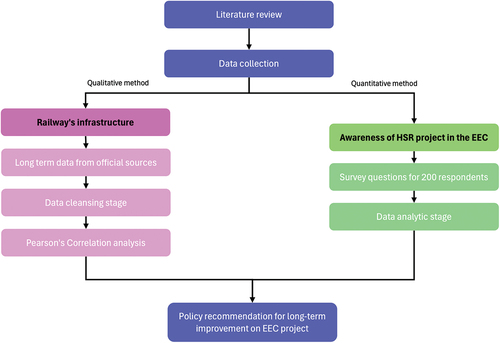
Table 1. Lists of logistic performance and economic factors.
Figure 3. The Pearson’s correlation result.
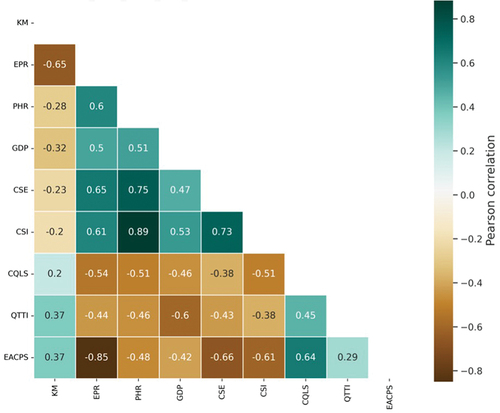
Table 2. The results of Pearson’s correlation (PCC), average values, and interpretation.
Table 3. The analysis of demographic.
Table 4. The analysis of public transportation and regional development.
Table 5. The analysis of an awareness of the HSR project in the EEC area.
Table 6. The analysis of an economic opportunities from HSR: industry, local business, and employment perspectives.
Table 7. The analysis of sustainability and social impact of the HSR project.
Figure 4. The frequency of public transport usage by respondents.
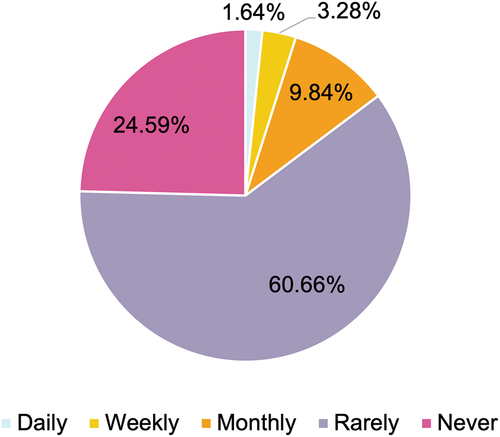
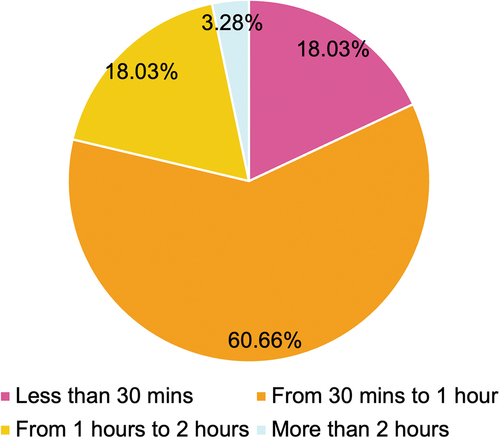
Figure 5. Travel duration data of the survey respondents.