
Figures & data
Figure 1. Steps in the novelty assessment method of Sarkar and Chakrabarti (2011).
Figure 2. SAPPhIRE model of causality (Chakrabarti et al., Citation2005).
Figure 3. Modification 1: Addition of a step to consider differences only in terms of inputs.
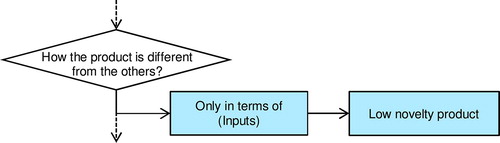
Figure 4. Modification to ascertain whether or not a product is novel.
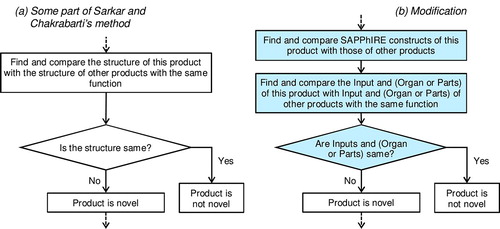
Figure 5. Illustration of products with different inputs and physical effects.
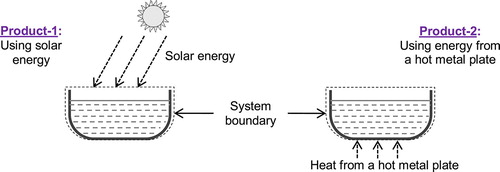
Figure 6. Modification 3: Addition of a step to consider differences in physical effects and inputs.
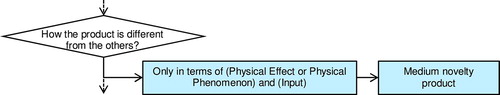
Figure 7. Conceptual solutions to lift a moderately heavy object.
Figure 8. Modification 4: Addition of a step to consider differences in inputs and parts/organs.
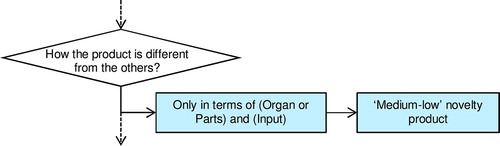
Figure 9. Refined novelty assessment method (Legend: M – Modification, see Section 3 for details).
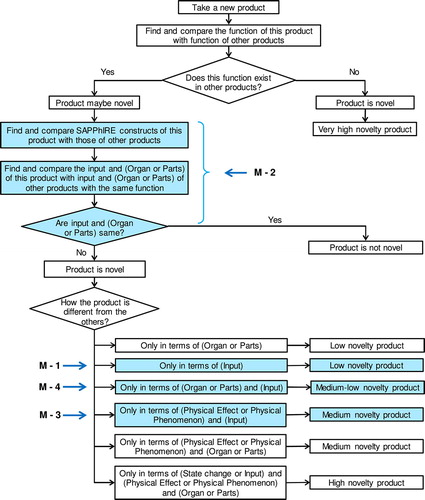
Table 1. Average novelty ranks by experienced designers, and by using the refined method and Sarkar and Chakrabarti’s method (3, 4 means the rank can be 3 or 4).
Table 2. Spearman’s rank correlations.