Figures & data
Figure 1. Comparison of C. glycerinogenes WL2002-5 and S. cerevisiae W303-1A for 2-PE tolerance on YPD agar. Cells were incubated in liquid YPD medium at 30°C for 18 h and diluted to an OD600 of 1. Cells (2 µL) at a dilution of 10−1, 10−2, 10−3, 10−4, and 10−5 were spotted on solid YPD agar containing different concentrations of 2-PE (0 (control), 1, 2, 3, 3, 4 g/l). Cells were incubated at 30°C.
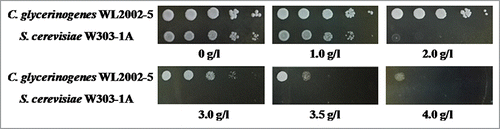
Figure 2. Comparison of C. glycerinogenes WL2002-5 (A) and S. cerevisiae W303-1A (B) for 2-PE tolerance in liquid culture. Cells were incubated in YPD medium at 30°C for 18 h, and diluted to the same concentration. Cells were inoculated into fresh YPD liquid medium containing various concentrations of 2-PE (0 (control), 1, 2, 3, 3.5, 4 g/l), and incubated at 30°C with shaking at 200 rpm. Open square, 0 g/l; solid circle, 1 g/l; open up-pointing triangle, 2 g/l; solid down-pointing triangle, 3 g/l; open diamond, 3.5 g/l; solid left-pointing triangle, 4 g/l.
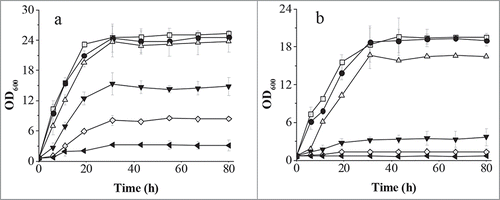
Figure 3. Gas chromatography of 2-PE produced by C. glycerinogenes WL2002-5 from L-Phe (A). MS spectrum of 2-PE produced by C. glycerinogenes WL2002-5 from L-Phe (B).
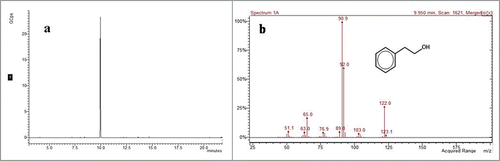
Figure 4. Effect of glucose (A), L-Phe (B), yeast extract (C) concentration, and temperature (D) on 2-PE production and cell growth. Biomass was measured using a spectrophotometer at 600 nm, and the 2-PE titer was determined by HPLC. Open square, 2-PE; solid triangle, OD600.
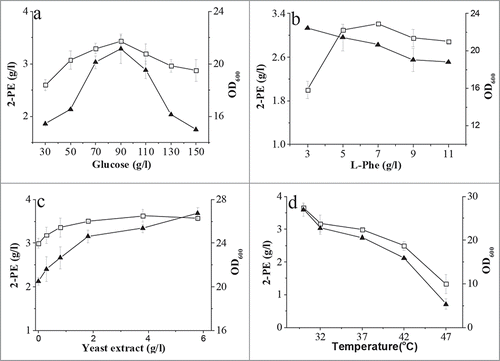
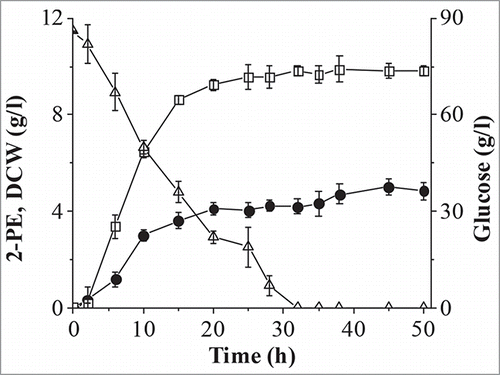
Figure 5. Batch fermentation in a 5 l bioreactor. Solid circle, 2-PE; open square, dry cell weight (DCW); open triangle, glucose.